This very short blog makes a case for investing precious quality time reading my book, Enterprise Intelligence. At over 500 pages, it’s a big book! That’s because it’s a foundational book, first pulling together a few big and complicated components of the analytics data space, then describing structures that emerge from a massive insight space.
My goal for the book is to make it as painless as possible to develop in you the critical integrated understanding of the big blocks that comprise an intelligence of a business. I took great care to provide as “friendly” an approach as possible with familiar examples, intuition underlying the ideas, and sometimes poor attempts with humor. It reflects almost all of my 26 years of experience in the enterprise business intelligence (BI) arena.
The message of my book begins with BI as the spearhead for genuinely transformative AI in the enterprise. BI data is deterministic, highly curated, and highly socialized, making it an easier and more reliable foundation for enterprise intelligence. But when augmented with the expanding capabilities of two structures, the Insight Space Graph and the connectivity of the Tuple Correlation Web, we get something transformative. A system that reveals insights we didn’t know existed, relationships that span across domains, and even the ability to real data to mitigate the need for synthetic data.
BI is grounded in hard facts—every query run through a BI platform returns results you can rely on. It’s deterministic, with no surprises. Interpretation is a different matter. But this is where my concept of Enterprise Intelligence comes in, adding something deeper to the equation. It’s not just about the data points you can see on the surface, but the connections, the relationships, and the insights waiting to be uncovered across the entire business.
The “first act” of my book (about half) is dedicated to organizing a set of “big word” technologies that might have taken a back seat since LLMs like ChatGPT burst onto the scene. That set of big words includes … well, here’s a Buzz Word Bingo card to illustrate. The big words are outlined in magenta:

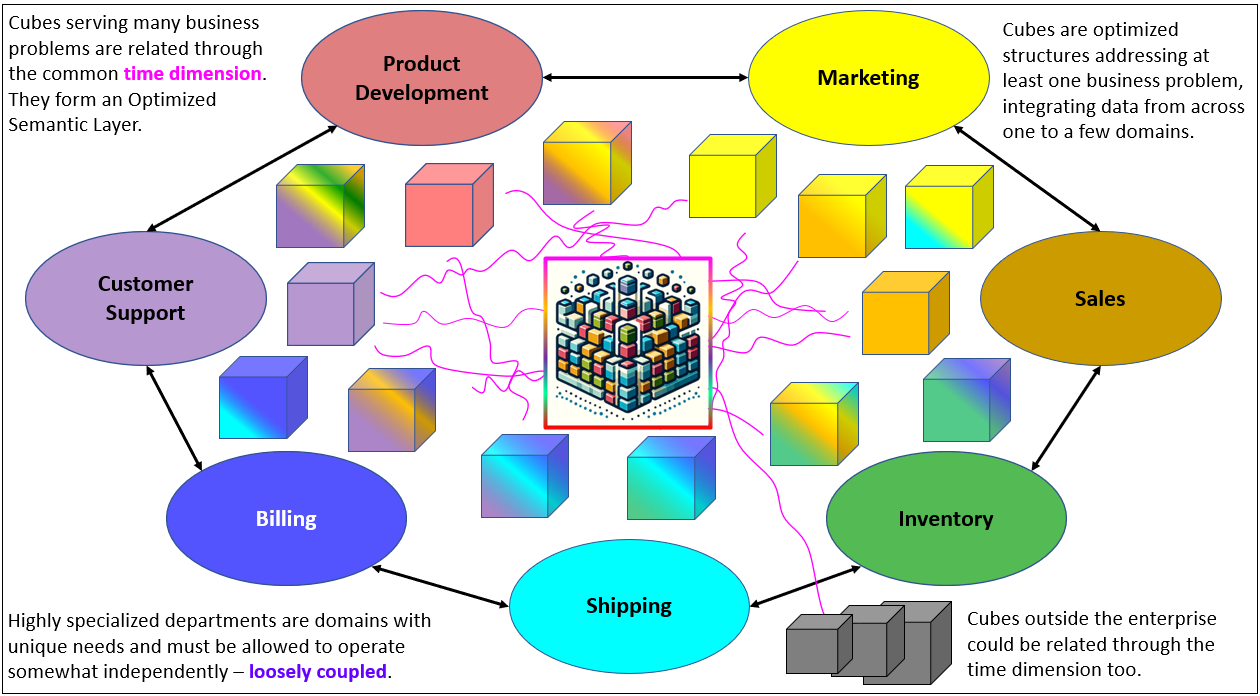
My book assembles those buzzwords into a form of Enterprise Knowledge Graph:

Exploring the Insight Space: The Insight Function Array and Insight Space Graph
The “2nd act” of the book deals with the exploration of Insight Space and two graph structures—the Insight Space Graph (ISG) and the Tuple Correlation Web (TCW). That is, the almost infinitely vast space of insights in your data.
Insight Space isn’t just some static repository or separate areas where each analyst explores in isolation. Think of it as a living, breathing ecosystem of insights that are continuously charted by the enterprise’s knowledge workers and expanded by efforts such as data mesh enabling onboarding of more BI sources into a semantic layer.
At its core, the Insight Function Array operates like a navigator, automatically charting every potentially valuable insight from the queries of thousands of knowledge workers. These queries, when run through the Insight Function Array, are processed across all appropriate visualizations, no matter the domain.
The ISG is the framework that helps make this happen. It ties together every query, chart, and result, drawing relationships and mapping insights like a starship charting a new galaxy. It connects knowledge workers’ efforts in every domain—whether it’s finance, operations, or HR—so that nothing is lost. The ISG spans the entirety of the Insight Space, making sure that what might be unknown in one domain is discoverable through the insights in another. And the beauty is that this happens automatically.
When a BI query is run, the system doesn’t just retrieve results for the current need—it processes the data through what I call the Insight Function Array—simple, highly effective functions to generate insights that can be applied across domains. Whether it’s a pattern in sales data, a trend in workforce performance, or a correlation in supply chain metrics, the ISG ensures that all insights are connected, contributing to an ever-expanding web of business knowledge.
Take a look at the illustration of the levels of space below. It captures the full complexity of how data flows from the physical space where events happen in the real world, all the way to the Insight Space itself. Here, every BI query runs through the Insight Function Array, which intelligently matches the query with the visualizations that best fit. From there, it runs the query results through a collection of simple yet powerful functions, surfacing insights at a scale unimaginable in the past.
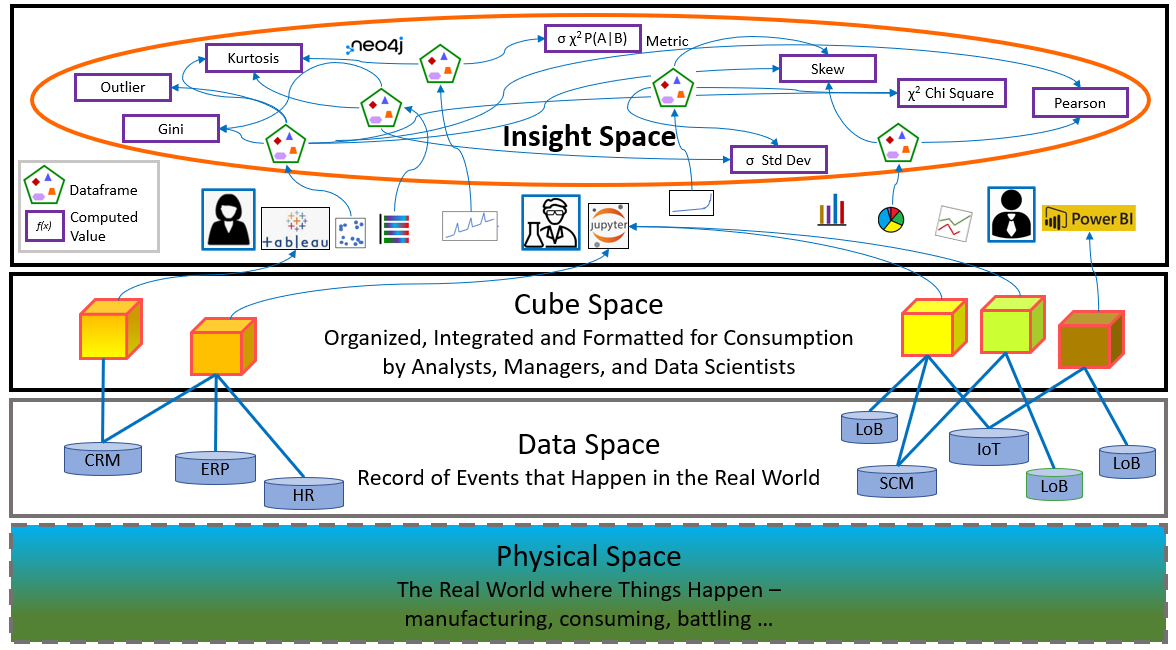
What makes Insight Space unique is that it’s not just the data. It taps into a near-infinite source of insights, surfacing new patterns and relationships from data across multiple domains. It pulls from the existing data fabric, data mesh, IoT, and even multi-modal AI, continuously expanding to reveal things we didn’t even know we could know. It’s an engine that never stops.
The Tuple Correlation Web (TCW): Drawing Hidden Connections
Paired with ISG is the TCW. It’s the relationship between the charted insights of insight space. This tool automatically builds correlations between data points—even those that don’t seem connected at first glance—by using tuples from BI queries. The date dimension serves as the key that unlocks these hidden relationships, allowing us to connect events and metrics across time and domains. The TCW enables us to spot patterns and relationships that could be clear on the other side of Insight Space, making it an incredibly powerful tool for unearthing unexpected connections.
Why I Believe BI Still Should Lead the Way
While AI will obviously make tremendous impacts (if not fundamental impacts), it often comes with non-deterministic outputs—correct for most conversations most of the time. But in a business setting, it’s not much help if you need to constantly fact-check it. BI, on the other hand, gives us highly-curated, deterministic data—it’s been the backbone of business decision-making for decades. In my view, BI spearheads this journey because it’s well-socialized within organizations, meaning it’s already embedded in daily operations, and provides a consistent, reliable platform for generating insights.
Insight Space as a Mitigator of Synthetic Data Needs
One of the more interesting applications of the ISG/TCW is its potential role in generating new knowledge. The near-infinite relationships that emerge from the Insight Function Array provide an almost endless supply of insights that can act as proxies for real-world data. This means even when there’s no historical data available for a specific scenario, synthetic data could be generated to fill those gaps, allowing organizations to model and simulate future conditions with greater accuracy.
Bridging the Gaps Between Knowledge Workers
The beauty of the ISG/TCW is that every knowledge worker contributes to it by their very own actions as a BI consumer. They are looking for information to solve a business problem they are dealing with.
Every query run, every report generated, helps to expand this growing pool of knowledge. Unlike machine learning models, which require specialized expertise, Enterprise Intelligence lets everyday workers tap into Insight Space. This allows knowledge workers to solve real problems by drawing on this vast pool of insights, without needing the complex infrastructure that AI often demands.
Shameless Pitch at the End of this Blog
For more information related to my book, the Enterprise Intelligence category of this blog site is a list of my blogs related to the book. I look forward to continuing the conversation and exploring how we can shape the future of BI and AI together.
Notes:
- Enterprise Intelligence is available at Technics Publications and Amazon. If you purchase the book from the Technics Publications site, use the coupon code TP25 for a 25% discount off most items (as of July 10, 2024).
- The “3rd act” of the book focuses on implementation, particularly retrieval augmented generation (RAG).
- Enterprise Intelligence: Integrating BI, Data Mesh, Knowledge Graphs and AI, is my long-version book description.
- A short-version description is the TL;DR.
