I’m in the first week of recovery from a pacemaker implant. My wife, primary care physician, ChatGPT, and I had been wracking our brains trying to diagnose the residual effects of a very odd and serious event I experienced in early October (2024). Every test came back negative.
The last result to arrive (Nov 14, 2024) was from wearing a Holter monitor (a “wearable” heart monitor device) for two weeks. That one came back with a serious event, even though I didn’t experience anything unusual during that time. I certainly didn’t expect the urgent call from a cardiologist I’d never met strongly urging me to come in immediately to implant pacemaker.
It’s been a couple of days since the two days (Nov 15-16) of poking, prodding, cutting, more poking and prodding, and fasting, I’m home recovering. Geez, I’ll never answer the phone the same way again.
To be clear, this isn’t a “pity post”. I’m very excited about the new things I’ve learned in relation to my pacemaker—a marvel of technology with a huge backing infrastructure. Like all bloggers, I’m just excited to share it—from an analytics point of view in my case. As a BI Architect/Developer of 25 years, my natural focus is always to analyze the problem space then design and execute the path forward.
A Higher Level of Understanding
Most of my colleagues around my elderly age are retired. So, most of you reading this around the time I published this blog (data and analytics folks) probably won’t face something like a pacemaker soon. But remember “death therapy” from What About Bob? There’s a deeper level of understanding that can only come with a brush with death. It’s beyond even “real-world” experience working for even decades on something you need to learn for your job or career or even a passion (as data/analytics is for me).
This is similar to one of the big themes in my book, Enterprise Intelligence, which is: How you can think you truly understand something, but you need to be living in the rough and tumble world to fully grasp it. In the book, I explore how to non-invasively capture what millions of frontline workers know about the real world through their efforts to resolve and/or work around their current real-world problems. Decision-makers, even if they were once frontline workers, are often a bit disconnected from current situations. We can’t all individually experience everything firsthand, but the aggregate of us has.
This gap matters because we need to incorporate the deep context of the real world—where we fail and learn in unexpected ways—into profound analytics. Facing a life-or-death situation lead to clarifying of my own domain knowledge of DW/BI in ways I wouldn’t have expected. This experience is a unexpectedly vivid example that pulls together edge-computing, telemetry, IoT, event streaming, data warehousing, what is very classic time series ML, and AI.
Telemetry and the Pacemaker
After arriving home from the hospital, I set up the telemetry box for my shiny titanium-clad pacemaker. This telemetry box wirelessly interrogates the pacemaker for data and submits it to the manufacturer, Boston Scientific. It really was a genuine plug-and-play experience, which is shocking.
Of course, I already understood very well how telemetry/IoT systems work and what happens when the data reaches the manufacturer. I’ve worked on them for many years. But seeing this system work for something as personally critical to me as my own heart was a different kind of experience.
A Bit of Personal Stuff for the Pacemaker Community
This blog isn’t about my journey to the pacemaker. It is quite a story, but not much different from the many brave folks who have posted YouTube videos on their experience. Those videos helped much during the first days after the surgery. As I mentioned earlier, I didn’t really have time to think about it between learning I needed one and getting it.
Here’s what I will contribute to the pacemaker community for those who stumbled on this blog hoping to learn from the experience of others:
Since my surgery (a major life event that was suddenly dropped on me), small things now remain small. I haven’t worried about countless stupid things like one-star reviews, getting something wrong, or otherwise messing up. After the first couple of weeks, you realize life hasn’t really changed that much for something so critical. Further gnarly problems will emerge over time, but the countless little shit doesn’t matter. It’s a wonderful gift.
Now, back to the cool shit I’ve been learning …
The Tools of Cardiology
Before this experience, I had a cursory understanding of technologies like ECGs, echocardiograms, and pacemakers. But I didn’t know much about how the heart works, the conditions that can arise, or Holter monitors. This life-changing event drove me to learn as much as I could.
Here’s what I learned. But before anyone yells at me, I don’t claim to have the expertise of a doctor, nor do I claim to know this subject. I’m just trying to learn all I can about something serious that was suddenly thrust into my life:
- Electrocardiogram (ECG/EKG): The ECG records the heart’s electrical activity using 12 leads, each offering a unique “view” of the heart from different angles. It’s the gold standard for diagnosing electrical abnormalities.
- Echocardiogram: This is an ultrasound that provides a real-time view of the heart’s structure and function. It’s used to assess pumping efficiency, valve function, and overall cardiac health.
- Holter Monitor: A wearable device that continuously records heart activity for hours to days, using 2–3 leads. It’s designed to capture trends and intermittent issues that a short ECG might miss.
- Pacemaker: The pacemaker is a therapeutic device that regulates the heartbeat. It also logs events like pauses or abnormal rhythms for later analysis, so it also has a diagnostic role.
Each of these tools serves a different, sometimes a bit overlapping, purpose, but together they contribute to a comprehensive view of cardiac health. But I can see that someday the first three devices could conceivably be merged into one device-while the pacemaker, being implanted would remain a separate device.
Edge Computing in Action
My pacemaker isn’t just a device that keeps my heart beating. It’s also an edge-computing system.
Unlike cloud-based systems, edge devices ingress and process data locally. My pacemaker monitors my heart’s electrical signals in real time, detects events (like pauses or arrhythmias), and responds immediately without relying on an external system. This autonomy is critical for something as time-sensitive as keeping a heart beating.
The telemetry box collects this data and transmits it to the cloud, where advanced analytics (and likely some AI) analyze trends and flag issues for my doctor. The telemetry box apparently does some edge-analytics as well as the pacemaker itself. It’s a layered system, and while I’ve built similar architectures in my career, seeing it work in this context gave me a deeper appreciation.
Learning to Read the ECG
Over the course of my surgery and the events leading up to it, I had an ECG at least four or five times. At first, I had no idea why they stuck so many leads on me or why they were placed in those particular spots.
Even though I’m not a doctor, just a silly programmer (as a doctor once reminded me), I’m driven to learn all I can about this. Since then, I’ve taken the time to learn more about how to read ECGs. It’s a genuine joy to have learned the basics of how to read those “heartbeat lines” we’ve always seen on TV and movies. These resources were especially helpful, but I think the first video is enough:
- Heart Conduction System & ECG — This is probably enough to get the gist of this.
- ECG Interpretation Made Easy — Almost the same as the first one, but some new material.
- Basics of 12-Lead ECG to How Waves Are Produced — In case you wondered about all those leads pasted to a patient.
The Heart
If you watch at least the first video, as a non-healthcare worker—who hasn’t been exposed to that level of anatomy—isn’t the heart unbelievably cool?! Even with hundreds of millions of years to evolve, how the f*** does that happen?! Think about our 4-chambered mammalian heart versus other classes of animals:
Two-Chambered Heart (Fish)
- Fish have a two-chambered heart with one atrium and one ventricle, which pumps blood in a single circuit through the gills for oxygenation and then to the rest of the body.
- This system is efficient for aquatic life but less so for land animals, where gravity and higher metabolic demands come into play.
Three-Chambered Heart (Amphibians and Reptiles)
- Amphibians added a second atrium, creating a three-chambered heart that partially separates oxygenated and deoxygenated blood.
- This adaptation supports their ability to breathe both through lungs and skin.
Four-Chambered Heart (Birds and Mammals)
- Birds and mammals evolved a four-chambered heart with complete separation of oxygenated and deoxygenated blood, enabling higher metabolic rates and endothermy (warm-bloodedness).
Extracting Event Segments from ECG Blips for Machine Learning
After watching the recommended videos, you’ll have at least the start of the working understanding of how an ECG represents the heart’s electrical activity through waves and intervals—at least for a data scientist to understand the ECG time series data. Following is a summary of this stuff, in case you didn’t watch the videos I recommend above.
I begin with a little drawing covering most of the parts of one of those heart beats:
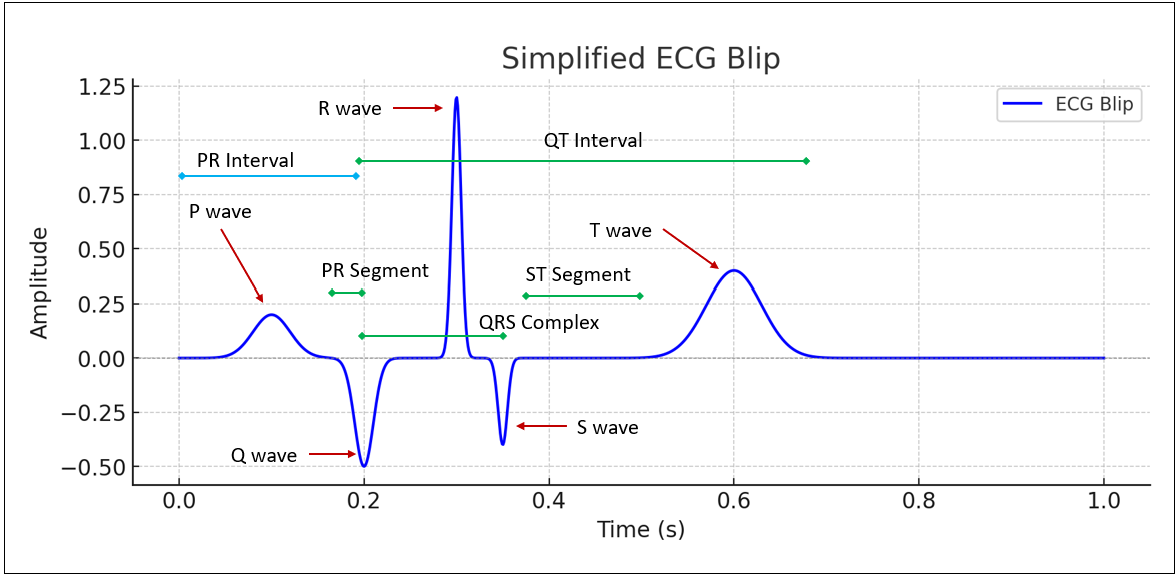
ECG Segments and Intervals
Each ECG waveform consists of named waves, segments, and intervals. These features reflect different phases of the heart’s electrical cycle and can be extracted as distinct events for analysis:
Waves
- P Wave: Represents atrial depolarization (when the atria contract).
- Key Data: Amplitude, duration, and onset time.
- QRS Complex: Represents ventricular depolarization (when the ventricles contract).
- Key Data: Amplitude, duration, onset time.
- Subcomponents:
- Q Wave: First negative deflection before the R wave.
- R Wave: First positive deflection.
- S Wave: Negative deflection following the R wave.
- T Wave: Represents ventricular repolarization (when the ventricles relax).
- Key Data: Amplitude, duration, and symmetry.
Segments
- PR Segment: Time between the end of the P wave and the start of the QRS complex.
- Represents: Delay in conduction through the AV node.
- Key Data: Duration (can be prolonged in conditions like heart block).
- ST Segment: Time between the end of the QRS complex and the start of the T wave.
- Represents: The period when the ventricles are depolarized and preparing to repolarize.
- Key Data: Elevation or depression (important for diagnosing ischemia or infarction).
Intervals
- PR Interval: Time from the start of the P wave to the start of the QRS complex.
- Represents: Time for electrical conduction from the atria to the ventricles.
- Key Data: Duration (normal is 120–200 ms).
- QT Interval: Time from the start of the QRS complex to the end of the T wave.
- Represents: Total time for ventricular depolarization and repolarization.
- Key Data: Duration (corrected for heart rate as QTc).
- R-R Interval: Time between successive R waves.
- Represents: Heart rate variability (HRV) and rhythm regularity.
- Key Data: Average duration, standard deviation, and irregularities.
Additional Derived Metrics
Beyond the raw segments and intervals, additional statistics and derived metrics are often used for machine learning models:
Heart Rate Variability (HRV)
- Definition: Variations in time between successive R-R intervals.
- Why It’s Useful: A lower HRV can indicate stress, fatigue, or cardiac dysfunction.
Wave Ratios
- T/QRS Ratio: Ratio of T wave to QRS complex amplitude.
- Why It’s Useful: Changes may indicate repolarization abnormalities.
Slope Analysis
- ST Segment Slope: The angle of the ST segment.
- Why It’s Useful: A downward or upward slope can signal myocardial ischemia.
Morphological Features
- QRS Morphology: Shape and duration of the QRS complex.
- Why It’s Useful: Variations can identify bundle branch blocks or other conduction issues.
Other Derived Metrics
- P-R Ratio: Proportion of P wave duration to PR interval.
- QTc (Corrected QT Interval): QT interval normalized for heart rate.
- P-wave Dispersion: Difference between the longest and shortest P-wave durations across leads.
Practical Applications
These extracted features are commonly used in:
- Arrhythmia Detection: Classifying rhythms like atrial fibrillation or ventricular tachycardia.
- Risk Prediction: Identifying patients at risk of sudden cardiac death or heart failure-that was the application for me.
- Personalized Medicine: Tailoring treatments based on individual ECG patterns.
Final Thoughts
I think I’m the first bionic person in my family. It’s too early to tell, but this event is most likely is not a setback, rather, it’s a restoration of my heart for what I need to continue riding this historic AI wave.
I’ll be able to finish my follow-up book, still present at the Data Modeling Zone 2025, continue the Prolog in the LLM Era series, continue to help Kyvos reach the level of success it deserves, witness the birth of ASI and production quantum computers, and enjoy at least a couple dozen more vacations at the national parks in Utah.
A big shoutout to the surgery and the post-operative recovery staff at St. Luke’s in Boise who worked on me. They were unbelievably friendly and competent. I can’t see how they could have done a better job at making a horrible thing at least somewhat comfortable.
This process required a cross-functional team, spanning professionals, enterprises like Boston Scientific and St. Luke’s, and even a bit of AI—I’m sure the initial reports of my ECG, echocardiograms, and Holter monitor data were AI-examined and generated.
Even if AI can eventually diagnose and plan treatments, the human touch will always be essential for humans. Moving from “all tests are negative, so it must be stress” to “you need surgery immediately” in a single phone call takes more than data—it takes empathy and expertise. I think there will be a need for very many nurses and PAs for decades to come—AGI/ASI or not.

I have a brain pacemaker or Deep Brain Stimulator as its called so completely relate to your post. I once had a lunch with someone who just wanted to know all about it and all we talked about was getting the data off it and analyzing it. That person was Sir Tim Berners-Lee
Hey!
Thank you much for the interesting comment. What a lunch you had! I just looked up your deep brain simulator – never heard of one, but I’m going to look more into it. It sounds like your device has more juicy stuff to analyze than my pacemaker.
Are you able to get data out? I have a feeling I won’t be able to get a digital copy of my data. I don’t wish for other devices in me for other organs, but it would be more interesting to correlate across multiple devices 🙂
Take care!
Eugene