What this page covers:
- Acquainting yourself with knowledge graphs through playing with Wikidata.org and playing with SPARQL using Wikidata’s query tool.
- Introduction to Semantic Web terms—SPARQL, RDF, OWL, IRI …
- Selecting a platform – I recommend Jena Fuseki as the open source graph database, Stanford’s Protégé as a visualization tool.
- Retrofitting your BI database for the Semantic Web.
- An MVP for BI visualizations—as discussed in Enterprise Intelligence, Contextual Information Delivery, page 284. Figure 1 shows the associated snapshot from the book, Figure 100 on page 285.
Important: For this baby step, you do not need to select a graph database or use Protege. I mention it in this baby step just to introduce the concept of RDF, semantic web, graphs, etc., before the next step of building ontologies and taxonomies.
For background on knowledge graphs please see Chapter 4 of my book, Enterprise Intelligence, page 93, Knowledge Graphs. For an understanding of the difference between “knowledge graphs” and the broader scoped “Enterprise Knowledge Graph”, see page 123, Enterprise Knowledge Graph (EKG) versus Knowledge Graph. Otherwise, I have glossary entries for EKG and knowledge graph.
By following this baby step, the team will be able to:
- explore Wikidata with SPARQL
- retrofit BI reference tables with IRIs
What do we get out of this baby step from learning about knowledge graphs to implementing unique Internation Resource Identifiers into out BI database?
Two big things:
- We enable the highly-curated, highly-performant, user-friendly, semantic layer into the well-defined identifiers of the world of the Semantic Web.
- We resolve the side-effect of the distributed BI advantages of data mesh. That is, the domain-level data products can be integrated into a connected, truly integrated semantic layer.
- Think of that as a built-in Master Data Management (MDM).
- The end-game of Semantic Web and MDM is to disambiguate terms (labels). That mitigates semantic misunderstanding.
Those are two powerful benefits for a BI system. Not bad for a first baby Step MVP (minimum viable product). And we’re only at the initial baby steps. The next two steps I’ll post in future blogs for incorporating an EKG into a BI system:
- Building an enterprise-wide ontology in a distributed data mesh fashion. Enterprise Intelligence, page 179, The KG Use for Data Mesh. It involves evangelizing and training:
- Training SMEs from enterprise domains on the basics ontologies and taxonomies, basics of the semantic web (basics of RDF/OWL), how to use the Protege semantic web visualization tool to author and view ontologies.
- Explore where ontologies and taxonomies already exists in the relational databases. i.e. every parent-child column pair is a taxonomy and database schemas already somewhat naturally compose into “is a”, “has a”, and “a kind of” relationships.
- Implementing the Insight Space Graph (ISG) and the Tuple Correlation Web (TCW): Enterprise Intelligence, Chapter 9: BI-Charged EKG Components, page 225.
Notes:
- This page was originally intended to be an appendix for my book, Enterprise Intelligence. But it didn’t make the deadline.
- This appendix applies mostly to vendors of BI platforms. However, at the time of writing (2023-2024), applying AI into BI is fairly blue ocean territory. So my target audience considered IT departments of large enterprises as “BI platform developers”.
- This is not a full enterprise knowledge graph design, and it is not an argument for replacing BI tools. This is a practical first step toward grounding BI concepts in semantic web meaning in a way that groups and individuals can explore without scale pain or semantic overhead on day one.
What is the Semantic Web and Why Does it Matter?
The Semantic Web is an extension of the traditional web in which data is published with explicit meaning so that systems—not just humans—can understand, link, and reason about it. Instead of organizing information as isolated tables or documents, the semantic web represents knowledge as a graph of things and their relationships. At its foundation is RDF, which models information as subject–predicate–object statements (triples). Each thing is identified by an IRI, a globally unique identifier that provides stable identity independent of labels or database keys.
Public IRI sources, such as Wikidata and other linked-data repositories, provide shared reference points that enterprises can align to while extending meaning locally. This matters because it enables consistent interpretation across systems, improves data integration, reduces ambiguity, and provides a grounding layer for knowledge graphs, analytics, and AI.
Introduction
Since ChatGPT 3.5 burst onto the scene in November 2022, incorporating AI has been pounded into our heads. In my case, that means incorporating AI into BI. That was easy for me because since 1998 I mistook the “I in BI” as the context of what it means for AI, not the context of gathering of “intel” as in the Central Intelligence Agency (CIA).
The idea of first introducing knowledge graphs (KG) into a BI environment smooths the tough task of AI adoption in an enterprise. BI is already the most “socialized” analytics layer in the enterprise—the measures are curated, the dimensions are governed, and access control is understood. That makes BI the safest place to introduce KG thinking without immediately triggering the two classic failure modes of enterprise AI—hallucination and semantic drift.
A KG and a Large Language Model (LLM, the AI we’re talking about) are naturally symbiotic:
- The KG grounds the LLM in reality. It provides stable identities (IRIs), explicit relationships (FKs elevated to semantics), and authoritative context (descriptions, taxonomies, ontologies). When an LLM answers questions against BI, the KG constrains interpretation so “customer,” “account,” “revenue,” “churn,” and “product” mean what your enterprise means—not whatever the model’s pretraining vaguely suggests.
- The LLM accelerates the KG. Building semantic metadata and ontologies is traditionally slow because it requires lots of writing, mapping, and reconciliation. An LLM can draft table/column descriptions, propose candidate external IRIs (e.g., Wikidata), suggest hierarchy predicates, and help SMEs refine terms—turning “semantic layer authoring” into a review workflow instead of a blank-page workflow.
See page 96, The KG and LLM Symbiotic Relationship, in my book, Enterprise Intelligence.
This lets you start with “baby steps”. That is, cache Wikidata alignments to what’s already in your BI semantic layer, create a local KG that grows gradually, and introduce semantic-web concepts in a way users can actually digest: IRIs, RDF, OWL, taxonomies vs ontologies, SPARQL, tools like Protégé, and graph databases. In this phase, scale problems are intentionally minimized. The goal is adoption and literacy, not “boil the ocean.”
Once users understand the power of explicit meaning—and once the organization learns how the KG and LLM complement each other—you can evolve to ontology-driven domain models (data-mesh style), and only later introduce the “scale layer” where you add emergent graphs like your ISG and TCW.
The Main Idea
Start by exploring Wikidata’s SPARQL environment to build intuition for triples, IRIs, and graph traversal with zero setup. Then move to an RDF store such as GraphDB Free or Apache Jena Fuseki, paired with Protégé for ontology editing and exploration. This keeps the learning curve gentle, avoids premature scale concerns, and stays aligned with semantic web standards. Neo4j can be used optionally for visualization, but should not be the semantic system of record at this stage.
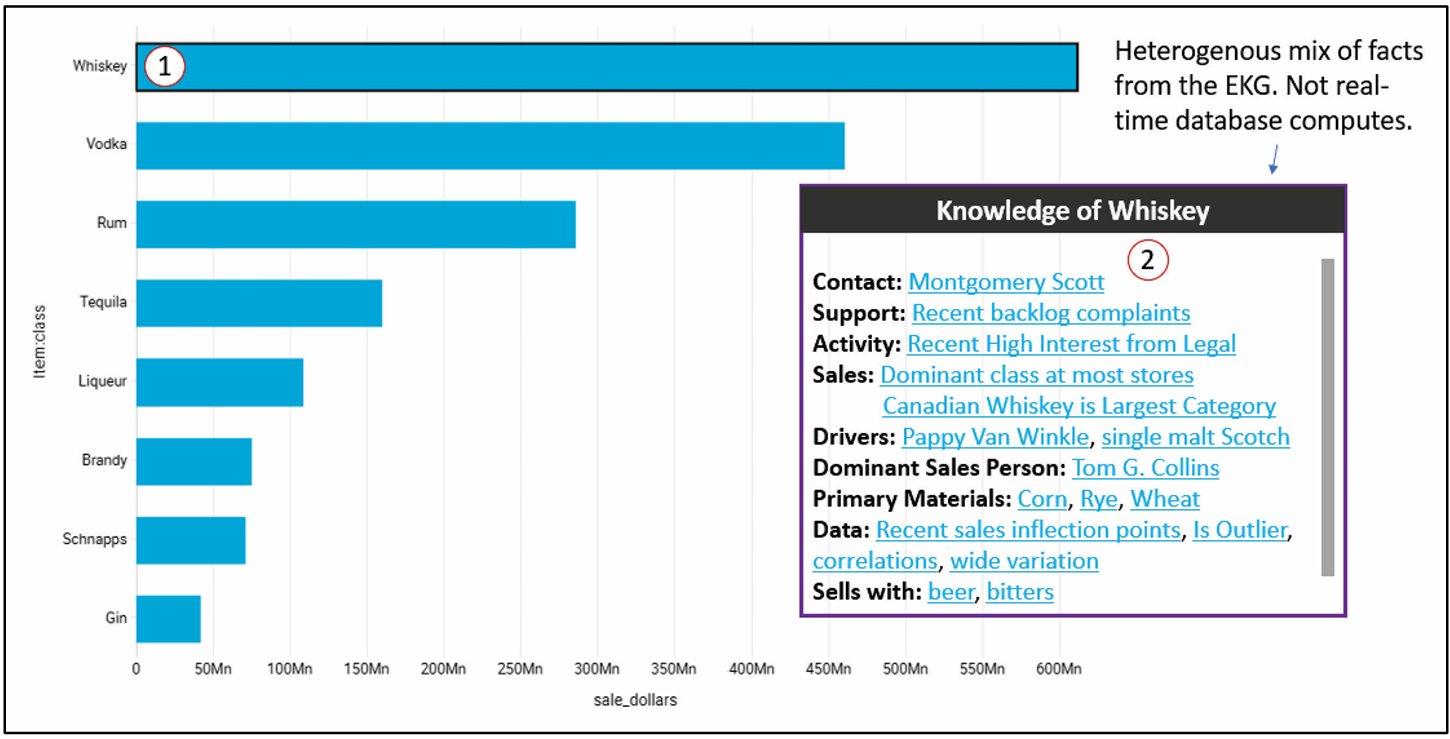
This MVP is discussed in Enterprise Intelligence, Contextual Information Delivery, page 284. Figure 1 shows the associated snapshot from the book, Figure 100 on page 285.
- Click on a member in a BI visualization.
- Up pops a window of open facts for that member sourced for the Enterprise Knowledge Graph.
Preparation
Following are topics on preparing for the MVP.
At the end of this page is a glossary of terms.
Source Knowledge Graph
For the first step in introducing knowledge graphs into a BI system, we use Wikidata. This is not because it is perfect or because it replaces enterprise knowledge, but because it is the only practical place to start. Wikidata is the most comprehensive, openly available knowledge graph in existence. It already provides stable IRIs, shared meaning across domains, and a public SPARQL endpoint. That combination is hard to replicate and unnecessary to reinvent.
Note: This is for learning and alignment. Production still lives in our KG, although we leverage Wikidata and other IRI sources to build the KG.
Wikidata gives us a common reference point for grounding BI concepts before we attempt to define our own ontologies. It allows users to learn RDF, SPARQL, and semantic web ideas using real data, without first committing to a complex enterprise modeling effort.
This does not mean enterprise knowledge lives in Wikidata. We must be good Wikidata users. Wikidata is the starting coordinate system, not the final model. That means:
- We query Wikidata, but cache what we retrieve into our own KG that we maintain and pay for.
- We self-police our utilization. For example, throttling automatic calls with a purposeful pause in between.
I introduce Knowledge Graphs in Enterprise Intelligence, Knowledge Graph Foundations, page 100.
Please other IRI sources for a list of major sources.
Familiarization with Using Knowledge Graphs
Since we’re using Wikidata, let’s now play with it to familiarize ourselves with the concepts around knowledge graphs.
I’ve created a very simple tutorial for getting your feet wet with querying Wikidata: A Baby-Baby Step: Learning SPARQL Using Wikidata.
Foundational Capabilities
Before selecting a graph database or worrying about visualization tools, there are three foundational technical capabilities you need in place. These are deliberately unglamorous, but they determine whether the knowledge graph becomes a living part of the BI system—or a side experiment that never quite connects.
Programmatic access to BI metadata
The first requirement is machine-readable access to BI metadata, in the same spirit as SQL Server DMVs.
You need to be able to programmatically query, not scrape, things like:
- databases, schemas, and tables
- columns and data types
- primary keys, foreign keys, and unique keys
- measures, dimensions, hierarchies, and attributes
- member labels and intrinsic unique names (where available)
This metadata feed is the raw material for:
- generating semantic-layer JSON
- proposing IRIs and relationships
- building the initial schema graph
- giving an LLM enough context to be useful instead of speculative
Without this, every downstream step becomes manual, brittle, or inconsistent.
A good mental model is that if SQL Server has DMVs for understanding the database, the BI system should expose something similar for understanding meaning.
Programmatic access to BI data
At some point you need controlled access to the actual data, especially reference and lookup tables. For example, ODBC, OLE DB connections.
Typical needs include:
- listing dimension members
- retrieving member labels and codes
- sampling non-sensitive column values
- extracting small, approved slices of data for disambiguation
This access is not about dumping data into a graph or an LLM. It’s about:
- grounding concepts in real values
- resolving ambiguity (“is this a product, an account, or a campaign?”)
- generating candidate IRIs for members
- validating hierarchies and relationships
A reminder of security. You need to be extra careful when dealing with your data and AI. When data goes into an LLM, it’s almost impossible to see where it went and how it’s being used:
- only approved tables
- only approved columns
- only approved row subsets
- ideally mediated by the BI platform’s existing security model
The key idea is selective visibility, not full data access.
Component Selection
Selection of an LLM
An LLM is used here as an assistant, not an authority. It’s like your know-it-all friend who know a lot about a lot of things, but doesn’t actually know everything and can unfortunately be over-confident.
In the early stages, the LLM’s job is to:
- draft table and column descriptions
- suggest candidate external IRIs (for example, from Wikidata)
- propose hierarchy relationships
- help normalize terminology across domains
It is not deciding truth. Everything it produces should be:
- reviewable
- reversible
- marked as proposed, not approved
For a first implementation, simplicity matters more than ideology. Using a well-understood LLM provider like OpenAI keeps the focus on learning the workflow rather than managing infrastructure.
You can always swap models later. The semantic layer and KG should be model-agnostic by design.
Graph Database Overview
At this stage, scale is not the primary concern. The goal is to learn how knowledge graphs work, how SPARQL feels, and how semantic concepts relate back to BI. That said, it still makes sense to choose something that can scale later, so early learning does not paint us into a corner.
Because this effort is explicitly semantic web–oriented (RDF, OWL, SPARQL), the simplest and cleanest approach is to use an RDF triplestore / semantic graph database as the system of record for the knowledge graph.
For a baby step, visualization matters. Seeing nodes and relationships helps users form intuition quickly, even if the visualization is not production-grade.
These options fall into two practical buckets.
Easiest to Start (Learning and Prototyping)
- Apache Jena Fuseki
A straightforward SPARQL server that can run locally or in a container. It is excellent for learning SPARQL and RDF fundamentals, but it has no meaningful built-in visualization. Visualization is typically done through external tools like Protégé or custom UIs.
This option is best when correctness and simplicity matter more than visual feedback.
Enterprise-Grade SPARQL (With Better Tooling)
- Amazon Neptune (RDF mode) A managed RDF graph service that supports SPARQL 1.1. Strong on scalability and operations, but not designed as a learning or visualization environment.
- Ontotext GraphDB One of the best “single-install” semantic web experiences. It includes:
- a SPARQL editor
- an ontology browser
- basic graph visualization
This makes it a strong candidate for baby steps where users want to see what they are building without assembling a large toolchain.
- Stardog Supports SPARQL 1.1, OWL reasoning, and governance features. It includes a web UI with query tools and limited visualization. Compared to GraphDB, it tends to feel more “enterprise platform” than “playground,” but it is still usable for early exploration.
Graph Database Recommendation
For this first step, the goal is learning and integration, not scale or performance. The emphasis is on understanding how semantic web concepts fit naturally alongside BI, and on giving teams enough visibility to see what they are building without committing to a heavy platform.
For a BI vendor, an open-source, standards-based approach is preferable at this stage.
For an open-source, baby-step implementation suitable for a BI vendor:
- Apache Jena Fuseki serves as the RDF/SPARQL system of record
- Protégé supports ontology and taxonomy authoring and exploration
This approach minimizes early complexity, preserves semantic correctness, and keeps visualization where BI users already expect it—inside the BI experience itself.
Apache Jena Fuseki is recommended as the semantic system of record.
When scale is deferred in this baby step, that does not mean the technology chosen is unscalable. It means scale is not the primary design driver for the MVP.
Jena Fuseki is a scalable open-source graph database built on Apache Jena’s mature RDF storage and query engine and is routinely used in production environments. It supports:
- large RDF datasets
- concurrent SPARQL queries
- persistent backends (TDB / TDB2)
- containerized and clustered deployments
What is intentionally deferred at this stage is architectural complexity, not capacity. This approach delays complexity, not scalability: Apache Jena Fuseki is production-capable, but early stages prioritize semantic correctness and integration over premature optimization.
This MVP avoids scale challenges not because Fuseki cannot handle them, but because other factors—such as semantic modeling discipline, ontology design, user experience, and integration with BI—are far more likely to determine success or failure early on.
More advanced scalability concerns emerge later, when:
- the knowledge graph grows beyond cached reference data
- inference and reasoning are introduced
- emergent structures such as the Insight Space Graph (ISG) and Tuple Correlation Web (TCW) are added
At that point, scaling strategies can be revisited with real usage patterns and requirements in hand.
Fuseki provides:
- native RDF storage
- full SPARQL 1.1 support
- compatibility with OWL and future reasoning layers
- simple local or containerized deployment
Fuseki is not a visualization tool, and it does not attempt to be one. That limitation is acceptable—and even desirable—because it keeps the architecture clean. Fuseki plays the role of semantic engine, not user interface.
At this baby step, Fuseki typically holds:
- cached Wikidata entities and relationships
- IRIs for tables, columns, and members
- lightweight schema-level relationships
- no enterprise-scale reasoning or inference
This keeps the focus on correctness and standards rather than presentation.
Protégé is used for ontology and taxonomy authoring, inspection, and learning.
Protégé complements Fuseki well because:
- it is open source and widely adopted
- it provides a visual way to browse classes, properties, and individuals
- it helps users understand OWL and ontology structure without writing code
The typical workflow is:
- Author or edit ontologies in Protégé
Classes, properties, taxonomies, and constraints are created or refined visually. - Export ontology artifacts (RDF/TTL)
Protégé produces standard RDF representations. - Load into Fuseki
The ontology becomes part of the local knowledge graph. - Query via SPARQL
Fuseki exposes a SPARQL endpoint that can be used by BI tools, scripts, or LLM workflows.
Protégé can also connect to Fuseki’s SPARQL endpoint for querying and inspection, even though live editing typically happens through file-based workflows. This separation is acceptable for early adoption and keeps concerns cleanly separated.
Generic graph visualization is helpful for builders, but it is not the primary goal of this phase.
For BI vendors, the most important visualization pattern is not a graph browser—it is the entity panel:
- a user interacts with a BI visualization (bar, slice, point)
- the user selects an object (product, customer, category)
- a contextual panel opens showing knowledge about that object
This mirrors how Google and Wikipedia surface knowledge graph content and aligns naturally with BI user expectations.
At this stage:
- the information shown can be limited to cached Wikidata facts and semantic metadata
- no real-time graph computation is required
- the BI front end remains the primary visualization surface
In this architecture, the knowledge graph feeds the BI UI, rather than replacing it.
Why Not Neo4j?
In my book, Enterprise Intelligence, I recommended Neo4j as the graph database for the tutorials. At the time of writing Enterprise Intelligence (2023-2024), graph databases and knowledge graphs were still rather fringe topics in BI circles, much like AI was before ChatGPT. Originally, I wanted to go with Stardog, a natively RDF-based database.
However, Neo4j was already somewhat well known, relatively to Stardog. Neo4j had offered a free desktop version since 2017. Many of my colleagues had at least played with it a bit. Weighing everything, I thought using Neo4j in the book took away some of the already huge amount of collective unfamiliarity in topics of the book.
Neo4j offers excellent native visualization and remains one of the best tools for building intuition about graphs. However:
- it is not SPARQL-native
- its primary query language is Cypher
- semantic web standards (RDF, OWL, SPARQL, SWRL) are not its native model
For a semantic-web-first approach—especially one that anticipates OWL and SWRL later—introducing Cypher at this stage adds unnecessary conceptual overhead.
Neo4j can still be useful as a temporary visualization aid during development, but it is better treated as optional and secondary, not as the semantic system of record.
This blog is about the semantic web, so it makes sense to use a true triple store (RDF database like Jena Fuseki, Stardog, and GraphDB), with native support for SPARQL and named graphs, plus ontology reasoning (built-in in Stardog/GraphDB, and available in Jena via its inference support).
Retrofitting the BI Database for the Semantic Web
Here are the steps to work our way through the MVP.
Phase 0 — Prereqs
This just summarizes what we’ve done so far:
- Learn SPARQL in Wikidata (team builds intuition: IRIs, triples, graph traversal).
- Select the semantic stack: Recommend: Fuseki (SPARQL store) + Protégé (ontology/taxonomy authoring).
- Enable programmatic BI access
- Metadata feed (DMV-like): tables/columns/keys/hierarchies
- Data feed: ability to list members + selected safe attributes
- Select LLM provider: Recommend OpenAI.
Phase 1 — Schema retrofits (physical changes)
Once the team is comfortable with semantic-web basics (for example, using Wikidata with SPARQL) and has selected a SPARQL store (such as Fuseki) and an ontology editor (such as Protégé), the next step is to retrofit the BI system to ground its entities and attributes in meaning.
There are the schema changes that should be made into the data tables. Specifically, these are the dimension, lookup, reference tables of the underlying data warehouse or “relationship view”. For example, Kyvos’ Relationships, and SSAS’s Data Source View.
- Add
IRIcolumn to reference/lookup/dimension tables: This new field should be thought of as another business key for a table row that represents an entity. For example, a customer table might have a business key such as CustomerCode. The customer, Eugene Asahara, would have a business key of AsaharaE. But an IRI would mostly be a URL that uniquely identifies me, such as https://eugeneasahara.com.- Column name is literally:
IRI - Type: string (sized for full IRIs). IRI could be rather long, but the vast majority are URLs, so about 200 characters is a good place to start.
- Constraints: unique + indexed; non-null after backfill
- Scope: entities people talk about (Product, Customer, Geography, Account, etc.)
- Column name is literally:
- Backfill
IRIvalues deterministically- Prefer stable business codes (SKU, ISO code, EmployeeNumber)
- Otherwise use surrogate keys (generated once; never regenerated for existing rows)
- Do not add
IRIto fact tables in this baby step- Facts pull the project into scale and governance too early.
- Keep the MVP focused on dimensions and reference data. In the future, you can address fact-level attributes (degenerate).
As an example, look at these two csv on my GitHub as comparison (or see Table 3 and Table 4 below):
Soon, we’ll meet the Python sample code that took us from the original Products table to the IRI-filled version.
Again, the IRI column in reference, lookup, and dimension tables should be thought of as another business key, unique the its row.
Phase 2 — Metadata appendix (semantic-layer JSON)
What differentiates Phase 2 from Phase 1 is that BI implementors (i.e. “BI Team” at an enterprise) are able to alter database schemas—adding the IRI column as another business key. However, there is a need for metadata related to the semantic web that go into components (off-the-shelf BI products) that BI implementors cannot modify. That is, unless you are the developer of that application. For example, semantic layer platforms such as Kyvos Insights or visualization tools such as Tableau.
Let’s assume you are not the developer/vendor of the semantic layer product. In that case, you can capture that semantic layer metadata into a JSON file and leverage it in your custom applications as needed.
Following are the pieces of metadata we must define.
Create long-form table descriptions (context for humans and LLMs)
For each table in the BI database, we need a description that captures the context of the table. For example, here are sample descriptions of about 100 words that an LLM can use to recognize the purpose of a table. Let’s pretend I wrote these by hand:
- Table Name: dimProduct. Represents the set of goods or services offered by the business for sale, tracking, and analysis. Each row corresponds to a distinct product entity with a stable identity used across sales, inventory, and financial reporting. Products are commonly organized into hierarchies such as subcategory and category to support aggregation and comparison. The table typically includes internal keys for joins, business identifiers such as product codes or SKUs, and human-readable name fields for reporting. Semantically, a product is a persistent thing rather than an event; while attributes may change, product identity should remain stable over time.
- Table Name: dimCustomer. Represents entities that purchase or receive goods or services from the organization. Each row corresponds to a customer identity that may represent an individual, household, or organization, depending on business context. Customers are central to analyses involving revenue, retention, segmentation, and geographic distribution. The table usually contains internal surrogate keys, business identifiers, name and address fields, and attributes such as customer type, status, or region. Semantically, a customer is a social or legal entity rather than a transaction, and identity should remain consistent even as attributes or classifications change over time.
- Table Name: dimEmployee. Represents people who work for the organization, including employees and, where applicable, contractors. Each row corresponds to an individual person with a stable internal identity used for workforce, organizational, and operational analysis. The table typically includes internal identifiers, employee numbers, names, titles, and attributes such as department, role, manager, and location. Semantically, an employee is a person distinct from their role or reporting structure; while positions and assignments may change, the individual’s identity remains the same across time and analyses.
These descriptions belong to a Product, Customer, and Employee table, respectively.
Table Description Using LLM
We could attempt to have an LLM assist us with writing these descriptions with minimal information. We could at least give it the table name and the names of the columns. table_description_prompt.txt is the template for an LLM prompt, requiring just the table name and columns.
We need to insert two parameters:
Inputs:
- Table Name: {table_name}
- Columns: {comma-separated column list}
We can replace it will this:
- Table Name: dimProduct
- Columns: ProductKey, ProductAlternateKey, EnglishProductName, Color,
Size, ProductLine, Class, Style, ProductSubcategoryKey,
ProductModelKey, StartDate, EndDate, Status
ChatGPT returned this description, which should be suitable for the purpose of matching dimProduct to the appropriate Wikidata QID:
Represents the catalog of products offered by the organization for sale and operational tracking. Each row corresponds to a distinct product entity with a stable identity used across sales, inventory, and financial analysis. Products are described through attributes such as name, color, size, and style, and are organized into structured groupings including product line, class, and subcategory to support aggregation and comparison. Temporal fields indicate lifecycle or availability periods. Semantically, the table models persistent commercial goods rather than transactions, enabling dimensional slicing, product performance evaluation, and hierarchical reporting across merchandising and supply chain domains.
Later, we’ll talk about automating the process of writing table (and column) descriptions for what is probably thousands of tables using some Python, database metadata, and an LLM. But for now, to go over the concepts, let’s just use these three tables.
Matching Description to Wikidata QID
What I want is for an LLM to take my three table descriptions, determine the subject of the table (what entity does it represent), and match it to a Wikidata QID.
This is the prompt I will submit to ChatGPT. Note that you need to paste the descriptions above, each in its own paragraph:
From these three descriptions, please return what you think is the most likely wikidata QID, in a comma-separated value format, your guessed table name, guessed QID, the label associated with the QID, and the IRI. [paste the 3 table descriptions from above here]
Here is the csv returned from ChatGPT:
table_name,guessed_qid,wikidata_label,iri
dimProduct,Q2424752,product,https://www.wikidata.org/entity/Q2424752
dimCustomer,Q852835,customer,https://www.wikidata.org/entity/Q852835
dimEmployee,Q703534,employee,https://www.wikidata.org/entity/Q703534
Save the csv into a file. let’s call it tables.csv. But be sure to have data stewards review this (it’s a CSV, so it will display well in Excel).
Table 1 shows the results in a tidier format.
| Guessed table name | Guessed QID | Wikidata label | IRI |
|---|---|---|---|
dim_product | Q2424752 | product (Wikidata) | https://www.wikidata.org/entity/Q2424752 |
dim_customer | Q852835 | customer (Wikidata) | https://www.wikidata.org/entity/Q852835 |
dim_employee | Q703534 | employee (Wikidata) | https://www.wikidata.org/entity/Q703534 |
Create long-form Column Descriptions
We need to figure out the semantic meaning of each column as well. The process is similar to the process for tables. For each column that is a key, code, label/description, or business-critical attribute, we need a description, again up to 100 words. The idea is the same as for the table. It should be sufficient such that an LLM can determine the context of the columns.
Here are descriptions that “I wrote” for a sample of product table columns:
- Column Name: dimProduct.[SKU]. is a business-defined stock keeping unit that uniquely identifies a sellable item for operational tracking.
- Column Name: dimProduct.[Description]. provides a human-readable name or narrative used in reporting and merchandising contexts.
- Column Name: dimProduct.[Category]. classifies the product within a hierarchical grouping structure, enabling aggregation, filtering, and comparative analysis across related product lines. Together, these fields support consistent identification and dimensional slicing in analytics.
As we did for tables, this is the prompt I will submit to ChatGPT. Note that you need to paste the descriptions above, each in its own paragraph:
From the following table column descriptions, return the most likely matching Wikidata item (QID).
Constraints:
• Assume a retail merchandise master data model at sellable SKU grain.
• Map to the real-world business concept represented by the column, not metadata or documentation about it.
• If the column is an attribute of a product, map it to the parent entity.
• Only return QIDs that you are confident exist and semantically match the definition. If uncertain, return NULL.
• Do not guess — prefer precision over coverage.Return in CSV format:
column_name, qid, label, iriHere are the descriptions:
[paste the column description from above]
Here is the response:
column_name,qid,label,iri
“dimProduct.[SKU]”,Q399757,stock keeping unit,https://www.wikidata.org/entity/Q399757
“dimProduct.[Description]”,Q2424752,product,https://www.wikidata.org/entity/Q2424752
“dimProduct.[Category]”,Q63981612,product category,https://www.wikidata.org/entity/Q63981612
Save the csv, let’s say columns.csv. Again, please be sure to have this reviewed by data stewards.
Table 2 is a tidier version for viewing.
| column_name | qid | label | iri |
|---|---|---|---|
| dimProduct.[SKU] | Q399757 | stock keeping unit | https://www.wikidata.org/entity/Q399757 |
| dimProduct.[Description] | Q2424752 | product | https://www.wikidata.org/entity/Q2424752 |
| dimProduct.[Category] | Q63981612 | product category | https://www.wikidata.org/entity/Q63981612 |
Bringing It Together: The Semantic Appendix JSON (Tables, Columns, IRIs, Descriptions)
At this point each reference/dimension table has a physical IRI column so every row can be addressed as an individual. Now, let’s consolidate the table and column information into a single JSON. The goal of this JSON is not to replace a BI semantic layer. It is a semantic overlay that:
- makes meaning explicit
- provides stable concept identifiers
- enables consistent linking across domains
- supports both KG construction and LLM grounding
Below is a template for a prompt to an LLM:
Please consolidate the following information into a single JSON document. The JSON format is:
Produce JSON using this schema:
Top level:
- version (string)
- namespace
- enterprise_base_iri
- ontology_base_iri
- tables[]
Each table must include:
- table {database, schema, name}
- row_identity {iri_column, keys_used[], generation_rule}
- entity_concept {iri, label}
- context_description
- display_fields {label_column, description_column}
- columns[]
- relationships[]
- hierarchies[]
These are the context descriptions of the tables:
[paste table descriptions here]
This is the Wikidata QID mapping to the tables:
[paste tables.csv here]
There are the context descriptions of columns:
[paste column descriptions here]
This is the Wikidata QID mapping to the columns:
[paste columns.csv here]
I’ve placed the filled-in prompt and resultant JSON in my GitHub repository
- Prompt to ChatGPT: cube_metadata_prompt.txt, you can use this for your convenience, avoid the pasting.
- Resultant JSON from ChatGPT: cube_metadata_appendix.json.
Filling the IRI Columns with Values
I mentioned earlier that in Enterprise Intelligence, I describe adding IRI columns to all tables where each row represents an object as an early step towards incorporating Semantic Web concepts into your data environment. So, I offer a small tutorial as a “baby step” example, using the GPT/Wikidata combo, that demonstrates a minimal, practical version of semantic grounding. That is, populating an IRI column in a conventional database lookup/reference table using Wikidata (at least for the tutorial) as a shared semantic backbone.
The overall idea is: Given a standard product table—complete with surrogate keys, UI captions, and richer descriptive context—the pipeline first uses an LLM to disambiguate intent and generate focused search terms. Wikidata is then queried to return a bounded set of candidate entities, and the LLM is invoked a second time only to select the best match, along with an explicit confidence score and rationale. The result is not a knowledge graph, but a semantically anchored table that can later participate in other knowledge graph structures. This mirrors real-world data-governance practice: partially automated, deliberately conservative, and designed for human review and gradual trust-building rather than blind automation.
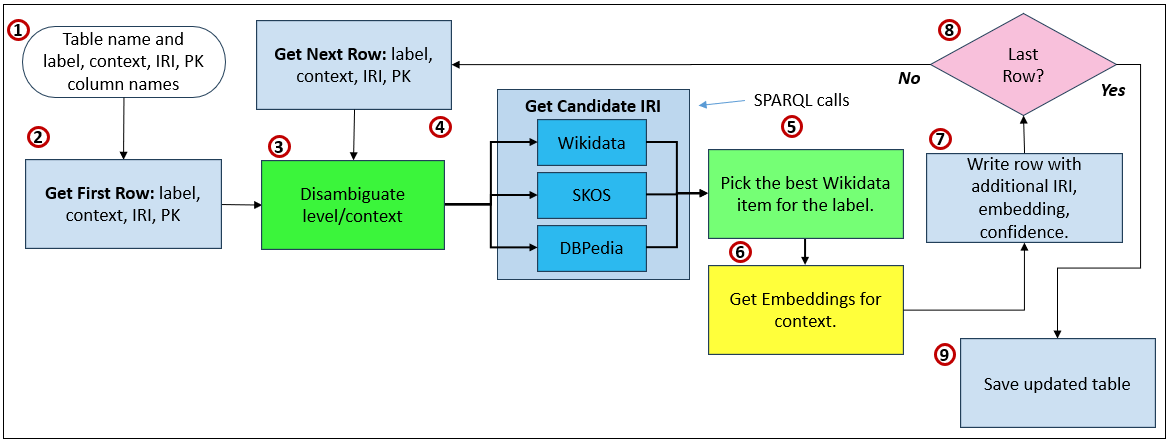
Figure 2 illustrates this:
- Define table semantics Specify the table name and explicitly identify which columns represent the primary key, label, descriptive context, and the IRI to be populated. This metadata provides the semantic frame for disambiguation.
- Read first row Load the first row from the table, extracting the label and contextual description that will be used to infer meaning.
- Disambiguate intent (LLM) Use an LLM to interpret the label in context and infer the intended conceptual meaning, producing focused search terms rather than authoritative identifiers.
- Retrieve candidate IRIs (graphs) Query external semantic sources—represented here by Wikidata (and optionally SKOS or DBpedia)—to retrieve a bounded list of candidate entities that match the inferred intent.
- Select best candidate (LLM) Invoke the LLM again, this time only to choose the best candidate from the returned list, providing a confidence score and rationale without inventing identifiers.
- Generate embeddings Optionally generate embeddings for the resolved context or relationship descriptions, enabling later semantic search and similarity matching.
- Write enriched row Write the original row back with the selected IRI, confidence score, rationale, and any embeddings added as supplemental metadata.
- Iterate rows Check whether additional rows remain and repeat the process until all records have been processed.
- Save updated table Persist the fully enriched table, now containing semantically grounded IRIs, ready for governance review or downstream use.
The sample Python code is at: fill_table_IRI_column_Wikidata.py Following are tables comparing the before and after:
| product_pk | product_code | product_caption | product_description |
|---|---|---|---|
| 1 | PRD-001 | Corn Grain | Raw agricultural corn grain used for food production and industrial processing. |
| 2 | PRD-002 | Bourbon | Distilled alcoholic beverage primarily made from corn. |
| 3 | PRD-003 | Ethanol | Industrial alcohol produced through fermentation of corn sugars. |
| 4 | PRD-004 | Corn Tortillas | Flatbread made primarily from nixtamalized corn. |
| product_pk | product_code | product_caption | product_description | product_iri | wikidata_qid | wikidata_label | iri_confidence | iri_rationale |
|---|---|---|---|---|---|---|---|---|
| 1 | PRD-001 | Corn Grain | Raw agricultural corn grain used for food production and industrial processing. | https://www.wikidata.org/entity/Q25618328 | Q25618328 | maize | 1.00 | This entity specifically refers to the seed of the maize plant, matching the product definition precisely. |
| 2 | PRD-002 | Bourbon | Distilled alcoholic beverage primarily made from corn. | https://www.wikidata.org/entity/Q543127 | Q543127 | bourbon whiskey | 1.00 | This entity precisely matches the description of bourbon as a corn-based distilled spirit. |
| 3 | PRD-003 | Ethanol | Industrial alcohol produced through fermentation of corn sugars. | https://www.wikidata.org/entity/Q194361 | Q194361 | ethanol fuel | 0.95 | This entity specifically refers to ethanol as a fuel alcohol, aligning with industrial usage. |
| 4 | PRD-004 | Corn Tortillas | Flatbread made primarily from nixtamalized corn. | https://www.wikidata.org/entity/Q15660894 | Q15660894 | corn tortilla | 1.00 | The candidate exactly matches the description of a corn-based tortilla product. |
At this stage, you’ve captured what you need to link your BI system into the world of the Semantic Web. That’s powerful!
How the Semantic Appendix JSON is Used
The cube metadata appendix JSON is an operational asset. Its primary role is to provide structured context that can be appended to LLM prompts and knowledge-graph pipelines so that enterprise data can be interpreted correctly.
When an LLM is asked to align a table, column, or row to a KG concept (for example, identifying the correct Wikidata QID), the raw field values alone are often insufficient. Ambiguity is common. A column named Name or Code could refer to dozens of different semantic meanings depending on context.
By appending the semantic JSON to the prompt, the LLM gains grounding:
- the table concept (what the entity is)
- column concepts (what attributes represent)
- hierarchical placement
- FK relationships to surrounding tables
- human-readable descriptions
- label/description fields suitable for context
This surrounding metadata acts like a semantic envelope around the row data, dramatically improving disambiguation when matching to external IRIs.
Scaling Context Authoring
An enterprise system may contain thousands of tables. Fortunately, this does not require manual assembly.
Metadata interrogation capabilities already exist in most BI platforms and relational engines. With programmatic access (for example, via DMV-style queries or catalog views), it is straightforward to generate context packages automatically.
A simple Python pipeline can:
- Iterate through tables in the BI semantic layer
- Extract column inventories
- Pull FK/PK relationships
- Capture one hop of surrounding tables
- Attach the semantic JSON overlay
- Submit the combined context to an LLM for alignment or enrichment
Even without submitting row data, schema and metadata alone provide enough signal for initial ontology mapping. Where row samples are allowed, they can further improve confidence—subject to governance and privacy constraints.
Visualization Context
Vendors of BI platforms—such as Tableau, Power BI (Microsoft), or Kyvos—have the ability to implement what is illustrated in Figure 1 in their product. The users of these platforms don’t have the ability to modify the code.
A user clicking a bar, node, or data point could open a contextual panel similar to the knowledge panels seen in search engines or Wikidata. That panel would be driven by the locally cached knowledge graph enriched by this JSON.
For organizations without embedded visualization tooling, the same experience can be delivered in their custom applications. At the baby-step stage, the goal is simply to allow authors and analysts to see what the KG knows about a selected entity.
Even when the initial cache is primarily sourced from Wikidata, the visualization provides a preview of what enterprise semantic enrichment will look like later.
Relationship to Master Data Management (MDM)
This semantic appendix behaves very much like a lightweight Master Data Management layer. Traditional MDM resolves identity across systems. The semantic layer extends this by resolving meaning.
For example, these tables have different names:
ClientCustomerAccountHolder
We humans know they probably refer to the same thing, but it would be of great benefit to make that explicit.
When each row has an IRI, and each table and column is grounded to shared concepts, alignment becomes possible even when naming conventions differ. This is particularly important in a Data Mesh environment, where domain data products evolve independently. Without a semantic bridge, the result is fragmentation—similar entities modeled differently across domains.
By grounding entities and attributes in IRIs, the LLM can evaluate semantic similarity across domains, helping link related data products without requiring centralized schema standardization.
In this way, the semantic appendix becomes:
- a disambiguation layer for LLMs
- an identity and meaning layer for KGs
- a semantic alignment layer for Data Mesh
- and an augmentation layer for MDM
Glossary of Terms
- Class A category of things in a knowledge graph. In BI terms, a class is similar to a dimension or entity type.
- Graph Database A database designed to store and traverse relationships efficiently. Some graph databases focus on semantic web standards, while others use property-graph models.
- Inference The ability of a system to derive new knowledge from existing statements. In semantic systems, inference is driven by ontology rules rather than procedural code.
- Individual A specific instance of a class. In BI terms, an individual corresponds to a dimension member or reference row.
- IRI (Internationalized Resource Identifier) A globally unique identifier for a thing in a knowledge graph. An IRI is not a name or label—it is the identity everything else refers to.
- Knowledge Graph (KG) A data structure where things are represented as nodes and relationships as edges, with explicit meaning. Unlike tables, relationships are first-class and directly queryable.
- Ontology A formal model of concepts and relationships within a domain. An ontology defines what things are, how they relate, and what assumptions can safely be made about them.
- OWL (Web Ontology Language) A language for defining formal meaning on top of RDF. OWL is used to describe classes, relationships, constraints, and logical rules within an ontology.
- Predicate The relationship part of an RDF triple. Predicates describe how two things are related, such as hasCategory or memberOf.
- RDF (Resource Description Framework) A data model for representing information as simple statements called triples: subject–predicate–object. RDF is the foundation on which most semantic web technologies are built.
- Reasoner A software component that applies logical rules from an ontology to infer additional facts. Reasoners help ensure consistency and uncover implicit relationships.
- Semantic Layer A metadata-driven abstraction that defines entities, relationships, and meaning above physical data structures. It allows multiple tools to talk about the same things consistently.
- Semantic Web A set of standards for representing meaning in data so different systems can understand and link information consistently. It treats data as a graph of things and relationships rather than rows and columns.
- SPARQL A query language for knowledge graphs, similar in purpose to SQL but designed for graphs. SPARQL queries meaning and relationships directly rather than joining tables.
- Taxonomy A hierarchical classification of things, typically parent–child. Taxonomies organize concepts but usually do not define rich semantics beyond “is a kind of.”
- Triple A single statement in RDF consisting of a subject, predicate, and object. Triples are the atomic building blocks of a knowledge graph.
- Triplestore A database optimized for storing and querying RDF triples. Triplestores typically expose SPARQL endpoints for querying knowledge graphs.
- Wikidata A public, community-maintained knowledge graph that assigns IRIs to real-world concepts and entities. Often used as a grounding source when aligning internal data to shared meaning.
Other IRI Sources
| IRI / PID source | Link | What it identifies well | Typical IRI pattern | Notes |
|---|---|---|---|---|
| DBpedia | https://dbpedia.org/ | General entities extracted from Wikipedia | http://dbpedia.org/resource/<Name> | Classic Linked Data hub; great for broad concepts and Wikipedia-aligned entities. (downloads.dbpedia.org) |
| Library of Congress Linked Data Service (id.loc.gov) | https://id.loc.gov/ | Names, subjects, works (library authority data) | http://id.loc.gov/authorities/.../<id> | Strong for bibliographic/authority use cases; widely referenced in library metadata. (id.loc.gov) |
| VIAF (Virtual International Authority File) | https://viaf.org/ | People/organizations across national library authority files | https://viaf.org/viaf/<number> | Excellent “authority hub” for names; crosswalks many library IDs. (VIAF) |
| ORCID | https://orcid.org/ | Researchers / contributors (individuals) | https://orcid.org/<####-####-####-####> | Gold standard PID for researchers; intended to be stored/used as a full URI. (ORCID Support) |
| ISNI | https://isni.org/ | Creators & contributors (people/orgs) across creative industries | https://isni.org/isni/<16-char> | Broader than academia; used across publishing/rights ecosystems. (ISSN) |
| DOI (doi.org resolver) | https://doi.org/ | Scholarly articles, datasets, reports (digital objects) | https://doi.org/<prefix>/<suffix> | The most common persistent identifier for “research objects.” (DOI Resolver) |
| ROR (Research Organization Registry) | https://ror.org/ | Universities, labs, funders (research orgs) | https://ror.org/<9-char> | Great for normalizing institution names (disambiguation + metadata). (ROR) |
| GeoNames | https://www.geonames.org/ | Places (cities, mountains, features, etc.) | “unique URL per toponym” | Huge coverage for place entities and lightweight geo-linked data. (GeoNames) |
| Getty Vocabularies (AAT / TGN / ULAN) | https://www.getty.edu/research/tools/vocabularies/lod/ | Art/architecture terms, places, artists/agents | Base like http://vocab.getty.edu/aat | Excellent for cultural heritage domains; designed for linking. (Getty) |
| GND (German Integrated Authority File) | https://www.dnb.de/EN/Professionell/Standardisierung/GND/gnd_node.html | People, orgs, subjects (authority data) | https://d-nb.info/gnd/<id> | Strong European authority backbone; explicit stable identifiers. (Deutsche Nationalbibliothek) |
| OpenAlex | https://openalex.org/ | Scholarly works/authors/institutions/topics | https://openalex.org/<EntityID> | Open catalog of research entities; IDs are expressed as URIs in docs. (OpenAlex) |
