Update note on June 10, 2023: This blog is very old and much has changed since 2010. Performance Point is no longer a thing, Predictive Analytics is now Machine Learning. However, the main message about the importance of the Strategy Map still stands. The notion of a Strategy Map as the primary BI object of an enterprise is still to me the Holy Grail of analytics.
I have this feeling that the notion of a strategy map has slipped through the cracks for many since it would be very difficult to implement back when Balanced Scorecards were popular in the late 1990s through 2000s. Of course, much has changed since then. In particular, machine learning (data mining, predictive analytics) and graphical tools are very accessible.
I plan to write an updated version of this blog to reintroduce the concept of pushing a strategy map as the central enterprise analytics object. I will link to it here where I have done so.
—————————-
There are two pieces of the Microsoft BI universe that I’m predicting will trend upwards with great vigor over the next year. The two pieces are the breakout for Predictive Analytics and the next step for Performance Management. These two pieces of the BI universe are crucial towards the goal of exponentially increasing the value of BI – a BI Stimulus plan:
- Predictive Analytics is crucial because the world operates on imperfect information. The world is unimaginably complex and so nothing ever happens exactly the same way. However, we can take a best guess with statistics-based Predictive Analytics.
- Performance Management is crucial because all organizations are like creatures struggling for survival. My blog, The Intelligence of Business, describes this notion. All creatures employ a strategy to compete against other creatures. Performance Management maintains the strategy as well as keeping a pulse on the effectiveness of the strategy.
- Predictive Analytics is mentioned in seemingly every issue of BI journals over the past few months and in business magazines such as Forbes. Analytics-focused software companies such as Predixion Software and Revolution Analytics are getting very much attention. I’ve written about my thoughts around Predictive Analytics in the Microsoft BI world in a blog (albeit maybe a little outdated) I wrote in February 2009, Why isn’t Predictive Analytics a Big Thing?
PerformancePoint Server 2007 (PPS 2007) introduced a great number of businesses into the world of Performance Management. The focus of Performance Management in PPS 2007 is the “scorecard” (hopefully a “Balanced Scorecard”) and so folks are now comfortable with Performance Management concepts such as KPI and strategic/tactical/operational. Figure 1 depicts a typical Balanced Scorecard.
The importance of Predictive Analytics and Performance Management and the conditions that are pointing to an impending pop in their utilization are awfully compelling in themselves. But what is even more compelling is bridging them. How does Predictive Analytics help Performance Management and vice-versa? That question is the topic of this blog. This is where we really make progress towards putting the “I” Back into BI (as this site’s tagline puts it), moving beyond the “glorified reporting” that has defined how the Microsoft BI stack has been utilized for the past decade,
Before describing the bridge between Predictive Analytics and Performance Management, I think I need to justify my thoughts around the next big step for Performance Management. I don’t think I need to justify Predictive Analytics similarly since it seems the justification for Predictive Analytics is well covered lately. A very good example is the Forbes article Power in the Numbers; as well as my aforementioned blog, Why isn’t Predictive Analytics a Big Thing? My thought for the next big step in Performance Management is the expansion of the role of the Strategy Map, depicted in Figure 2.
All of us who work in a large corporation are now well familiar with Performance Management via our participation in our performance reviews. Through Performance Management, we know better what is expected of us, where we fit into the bigger picture, and where we are dropping the ball. There is also a better ability for us to receive the right information at the right time to help us execute our assigned role.
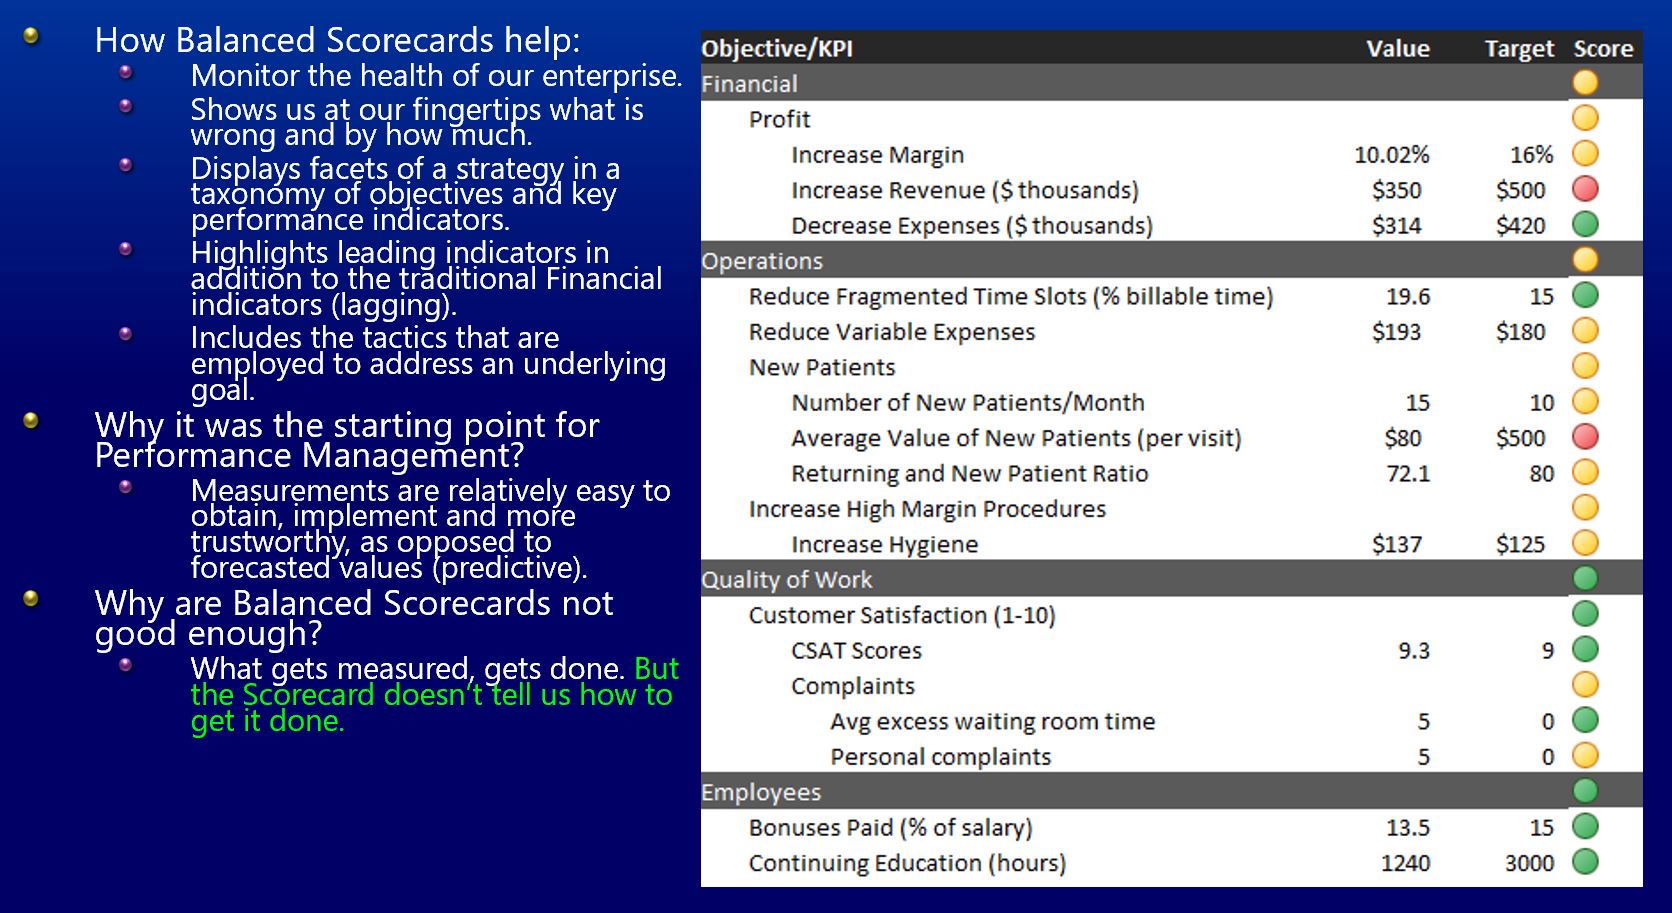
The entry point for us into this world of Performance Management is the Balanced Scorecard. Scorecards facilitate the mantra, “What gets measured gets done.” The scorecard lists our key performance indicators (KPI), the value of the KPI, the target value (goal), a score indicating how well we’re doing towards reaching the target, and a sccore indicating the trend of the KPI. Every morning or several times a day we view our scorecard to see which of our targets are in pain or take pride in seeing that all of them are being met.
There are many reasons why a Balanced Scorecard, no matter how well designed, can lead to a false sense of operational security:
- The fallacy of “If meeting my sales is good, meeting 10 times my sales is 10 times better”. Exceeding targets means too much effort is placed on a KPI which probably means others are neglected. And the unexpectedly high sales may affect someone else. I’ve written about this notion in my blog, KPI Cause and Effect Visio Graph.
- Too many unexpected things can happen or the “theory” behind all of the KPIs is insufficient. Meaning that it’s not true that if everyone meets all their targets the organization meets their goals.
- True, what gets measured gets done. The problem is that “getting things done” is often incredibly tough and support in figuring out how to address a problem (without messing up something else) would be very nice.
The Balanced Scorecard tells us what needs work or what is going wrong (ex: sales isn’t reaching its target). It can even help us get to the root of the problem by allowing us to drill down to greater detail (which salespeople are behind on their quotas). This is akin to the symptoms you report to your doctor, the further tests a doctor makes, and a diagnosis. It tells us the “what” and to a lesser extent the “why” of a problem, but it doesn’t do much to help us figure out how to fix the problem.
It’s said that recognizing the problem is half the battle. Maybe that’s true if we average it all out, but often enough, recognizing the problem is merely the declaration of war. When using our human intelligence to determine how to solve a problem, we run experiments in our heads using models of cause and effect that we’ve learned throughout of lives.
A cause and effect graph is already part of the Performance Management world in the form of a Strategy Map. The Strategy Map as it’s normally implemented in the Microsoft BI world is a Visio document, surfaced through a PPS 2007 dashboard, of high level cause and effect between KPIs. Figure 2 depicts a typical Strategy Map.

The problem with a Strategy Map as it’s currently implemented is that it’s a rather dead document. It mostly maps how one KPI is related to another. It says nothing about how a KPI affects another. At best, the color of each node may reflect the color of the KPI’s score. Using a healthcare analogy, it’s like saying lowering my cholesterol is good, but says nothing about how it results in my better health. It’s a start, but we can certainly do better. Therefore, my opinion is that the next phase of Performance Management will focus on the expansion of the role of the Strategy Map.
So why didn’t we put more focus on the Strategy Map to begin with? Mapping cause and effect is much more difficult than monitoring measurements. For example, many people can take your blood pressure and pulse, but fewer people (doctors) can prescribe how to treat a medical problem. There is no fuzziness in measurement, but a lot of assumptions with Strategy Maps. Collecting and presenting measurements through a Balanced Scorecard is feasible and a great starting place. After all, recognizing the problem may not be half the battle, but it’s where we need to start nonetheless.
However, mapping cause and effect is incredibly difficult and beyond the scope of this blog (I’ll have blogs on that topic some time). We all know the notion of fixing one problem and creating another unexpected problem. But one way or another, if we are to keep asking more and more from our computers and expect to support more and more people on this finite planet, we are going to have to dive into building cause and effect graphs. Cause and effect maps are what is behind intelligence and it’s a matter of starting somewhere and enjoying a long road down the evolution of them. Generals and CEOs have a always have a strategy in mind that can be articulated on paper, even if not to such an extent that unexpected things hardly happen.
The good news is that it’s not a matter of doing it or not doing it. We can start with the high level Strategy Maps currently in place and build detail progressively as mapping tools improve over the years. In an ideal world, all cause and effect would be mapped thereby allowing us to predict the future as accurately as we can calculate the total of a shopping cart. However, for philosophical and physical reasons (see Imperfect Information), we can only ever map cause and effect to a relatively high level. Our world is an interaction of countless objects which never presents the exact situation more than once.
This gets us to the bridge between Predictive Analytics and Performance Management: Use Predictive Analytics to take best guesses at our relatively high level causes and effects. Each cause and effect (each line between a node pointing to another node) is an assertion that comes with some level of doubt. For example, does increasing customer satisfaction lead to more patient referrals? That’s probably a true statement. But by how much? If some patients are like me, one thing that may attract me to a doctor is the ability to secure an appointment with short notice. Just as I tell everyone lies of how awful it is to live in Idaho (so everyone in the world doesn’t move here), I may want to keep my doctor a well-kept secret.
Figure 3 depicts a simple implementation of a tactic to increase profits (raising fees) and the possible effects. This simple relationship spawns many questions that can be answered to some level of confidence through Predictive Analytics. Raising fees should ultimately increase revenue, but it wll have side-effects. One is that some percentage of patients will defect to a doctor with lower fees. But how many? Who are they? Are they patients the doctor just as soon not see anymore anyway … hahaha? So many questions are raised to answer the original question, each with imprecise answers where a Predictive Analytics model could at least provide an educated guess.

Another factor stifling the creation and utilization of cause and effect graphs is maintenance. Things are always changing. It’s hard enough to map a system of causes and effects that aren’t moving. However, Predictive Analytics models ease maintenance burdens by:
- Validation – Models can be built to validate that the assertions of cause and effect are indeed true.
- Retraining – Predictive Analytics models in themselves are malleable to an extent and adjust their rules based on the latest data.
The bottom line is:
- Predictive Analytics is enhanced by this bridge because the expanded role of the Strategy Map creates the need for so many more data mining models.
- Performance Management is enhanced by Strategy Maps beginning to answer or at least shed more light on “how to” questions, rather than just “what” and to a lesser extent “why”.
- The entire value around BI is greatly improved since it is able to deliver much more compelling information.
With all that said regarding the seeming futility of developing exhaustive cause and effect graphs, it is still possible to build them to a deeper extent if we’re able to effectively isolate a system … which is the case with systems such as automobiles, the human body, an isolated ecosystem, and SQL Server. Figure 4 depicts a partial view of my attempt to create an exhaustive mapping of the cause and effect relating to SQL Server 2000 performance. I created that graph in 2005 in an attempt to deploy a system that could produce what could be loosely called “novel” resolutions to SQL Server performance problems based on various traces and logs.

As ugly as the graph in Figure 4 looks, it actually worked to a limited extent. Well enough anyway considering I only invested about 100 of the 300 to 500 hours it would probably take to fully author – not to mention the 400 hours of mostly my personal time developing an application to perform the authoring and querying of the graph. Unfortunately, I didn’t have the time to complete the graph due to the hectic life of a Microsoft employee (where I worked at the time). I still believe it is possible to build such graphs and that authoring such graphs aren’t any more intellectually challenging or time-consuming than writing a 1000-page book on the subject.
The reason I bring this up is to suggest that the mapping and maintenance of such cause and effect graphs is vital in the effort to make our systems smarter. They are not something to shy away from because of the daunting difficulty, but represent the first steps in a really long journey towards the holy grail of computer: artificial intelligence. Bridging Predictive Analytics and Performance Management results in a sensible start.
On a final topic, it’s worth mentioning something about agility, the other weapon against the complexity of the world. Our best guesses will be wrong some percentage of the time no matter how sophisticated our models are. Being agile means to devote some part of our resources for contingency plans. In fact, we use Predictive Analytics to measure the risks of events we can imagine in order to determine how much resources to devote to protect us from the possibility of a disruptive event. It’s impossible to cover all bases so we attempt to imagine events that can thwart our execution and devote resources towards dealing with those with the combination of devastation and likelihood.
For events we could not predict that blindside us (the so-called “Black Swans“), a comprehensive cause and effect graph can be instrumental in discovering them. This notion is way beyond the scope of this blog. This is the realm of applications such as anti-terrorism efforts, credit card fraud detection, or Texas Hold Em Poker where the point is to blindside.

Warren L. Rutledge: That\’s really the power of BI, a more objective window into the system. Of course the follow on challenge is to know if the necessary systems are capable of performing to the level needed to drive the strategy forward. In my experience, this is where most companies fall down. They have a decent strategy, but don\’t have a deep enough understanding of their own systems to understand the constraints and various feedback loops that impede the execution of the strategy.
Eugene Asahara: I knew I could count on Warren for great feedback! Yes, the first step for PerfMgt was to educate all information workers on KPIs and highlighting was wasn\’t going well. This at least aligned efforts if not prescribing more effective actions. Cause and effect is tougher and should be the next focus for the mature (PerfMgt-wise) organizations who wish to advance beyond the scorecard.