Introduction
Data Mesh is one of many current buzzwordy concepts addressing what is often underwhelming perceived value from Enterprise Data Warehouse (EDW) implementations. Similar current concepts include data fabric, data virtualization, and data marketplace. None of those concepts are mutually exclusive. They all somehow facilitate mapping diverse data from across an enterprise for ready consumption by a diverse set of analytics consumers.
But Data Mesh lays a critical step towards the sore spot I’ve dealt with for over twenty years as a Business Intelligence (BI) architect. The sore spot is the difficultly of integrating diverse data in a timely and maintainable manner. The critical step is that Data Mesh addresses this through the decomposition of a centralized EDW and the EDW team into coherent Data Products and Data Product Teams broken down along domain boundaries.
This is reminiscent of Domain-Driven Design (DDD). In fact, it is indeed the traditionally OLTP-focused DDD applied to the OLAP side. It’s a more profound step than merely producing an elaborate discovery tool for consumers, a “Yellow Pages” (if anyone still knows what that is) of data.
The set of coherent domain-level data products could then be linked into a loosely-coupled mesh, readily capable of evolving with the ever-changing processes of the enterprise as well as adaptive strategic analytics use cases.
The links between the data products are themselves data products. For example, well before “Data Mesh” was coined, each entity addressed by Master Data Management (MDM) was a data product owned by data stewards and jointly created and maintained with data engineers.
The primary theme of this blog series is to explore how a Data Vault is a very logical choice for an enterprise-wide data warehouse component of the Data Mesh. A Data Vault fits in very well with the Data Mesh notion of a “self-serve data infrastructure as a platform”, one of the “four pillars” of Data Mesh.
Data Mesh with Data Vault is a powerful match since both:
- Facilitate a comprehensive and up-to-date model of an enterprise.
- Extend the systems-thinking principles of the OLTP-side Domain-Driven Design to the OLAP side.
- Mitigate the change friction associated with dependencies through decomposition by domain boundaries.
- Scales out the development and maintenance efforts, by moving from a centralized EDW team to data product teams, again through decomposition by domain boundaries.
This is Part 1 of a 5-part series describing the process from a very untidy understanding of the enterprise-wide system to an integrated and maintainable model composed of Data Products.
My Old DDD/DVM Blog
Following along with this blog series helps if you have familiarity with the major components of data vaults, data mesh, and DDD. If not, my prior blog from a year ago, Data Vault Methodology paired with Domain Driven Design, is a good place to start for a description of DDD and the Data Vault.
The primary theme of that blog is describing how the OLAP-side Data Vault Methodology complements the OLTP-side Domain-Driven Design. However, Data Mesh is more like an OLAP-side counterpart to DDD. In fact, in that blog I briefly cover the topic of this blog, data vault within a data mesh.
That blog also includes links to many carefully chosen sources (mostly videos) on all of the topics. I reference that older blog a few times throughout this blog, so I’ll refer to it as “the DVM/DDD blog”.
Data Vault as the “Data Warehouse Layer” of Data Mesh
Figure 1 illustrates a set of three Data Product domains (the columns bordered by dashed lines – Sales, Finance, and Inventory). Figure 1 is the punchline of this blog series. Each domain is responsible for the development and maintenance of their contribution to the Data Mesh – a componentized EDW. The domains’ endpoints are the customer-facing part of the Data Products (hexagon shapes at the top of the brown layer) exposed to a host of analytics consumers using a variety of query/visualization tools.
Orthogonal to the three domain columns are horizontal layers spanning across them:
- Analytics Consumers (green) – Collection of consumers of domain-level Data Products, human and machine.
- Data Marketplace (yellow) – An application from which consumers can find data across the data products and utilize services such as requesting access.
- Consumer-facing layer (brown) – The Data Products exposed to the users. It should be in a format readily understood by the consumers and highly-performant.
- Data Vault (blue) – A versatile data warehouse containing data from across the domains.
This is a self-service “Data Platform as a Service”. However, “self-service” covers a wider space than the more familiar “self-service BI” my BI-focused colleagues are used to. At least in the OLAP-side of the fence where I mostly play, “self-service” normally refers to powerful query/visualization tools used by “power users”. Here, self-service refers to a relatively user-friendly, reliable, secure, enterprise-wide platform for data engineers to build and deploy their domain-level objects. And it includes the APIs from which consumers access the Data Products.
In the context of this blog series, the most salient part of Figure 1 are the arrows pointing from the domain OLTP data sources into that single Data Vault (the big red-lined box) and out to the hexagon-shaped customer-facing data products.

Following are captions for the numbers (circled in red) in Figure 1. Please pardon that the numbers bounce around in this figure:
- Data Products (the hexagon shapes) meeting Enterprise-wide SLAs are available to users across the enterprise.
- Access to the highly-curated domain data products, facilitates self-service BI. The data products are easy to find (via a Data Marketplace), easy to understand, well documented, reliably available, highly performant, and secure.
- Consumers of many interests access the Data Products using a variety of query and visualization tools. The consumers can be human or machine and receive the data in a variety of formats.
- The blue lines form a composed mesh of data products.
- Self-service, enterprise-wide layers are provided by the Data Governance team. Functions can include:
- Provides a self-service analytics Platform as a Service (PaaS).
- Scalability, security, performant, relatively easy to use.
- Enterprise-wide metadata catalog provides an awareness of the existence of all data.
- Master Data is its own domain under the Data Governance Office.
- Sets SLAs for data products across domains.
- Each layer can be considered a Data Product in itself.
- Domains can have multiple data products.
- A Data Product can be a composition of multiple Data Products. For example, the Finance Data Product is composed from Finance data and the data products from Sales and Inventory. Note the green line connecting the Finance and Inventory Data Products.
- The consumer-facing layer presents user-friendly, highly-performant schemas to the analytics consumers. Most would probably be in the form of familiar star/snowflake schemas, and possibly even accelerated by OLAP cubes.
- The Data Vault layer provides a versatile data structure where data from many domains and stages can exist in one place, while allowing flexibility required by domains. The Data Vault is comprised of two parts:
- The Raw Data Vault. It holds a historic, mostly unaltered version of data extracted from the OLTP sources.
- The Business Vault (consumer-facing layer). It is a set of transformed tables built solely from the tables of the Raw Data Vault. The data is the Business Vault is cleansed and optimized for querying. This is a good portion of the “T” of ELT.
- Star schema Data Marts extracted from the Business Vault are what is exposed to the customers.
- Each domain is free to handle their own ETL into the data vault. Domains may consist of streaming, connections to a diverse range of data sources.
- OLTP data is extracted and loaded into the Raw Data Vault – the “E” and “L” of ELT.
- The data products are developed and maintained by folks in the enterprise domain, the people who know that data best. By creating data products within a domain, the domains are mostly free from dependencies on other domains.
Note that within the Data Vault box (the red-lined box in Figure 1), there is an Azure Synapse icon in the Business Vault and an Azure Data Lake Storage icon in the raw vault. The choice of the Azure products are just as an example to suggest that the Raw Data Vault could be considered “cool storage” in a cheaper data lake, whereas the Business Vault tables could be deployed on something more performant (hot storage) such as Azure Synapse (or Snowflake).
TL;DR
I’d say at this point the main idea has been presented. Data Mesh decomposes a centralized, monolithic EDW into independent domains, and Data Vault enables those independent domains to attach diverse data in a versatile but structured way. That “structured way” (the Data Vault Methodology) is the difference between simply placing data from all domains into a highly-scalable Cloud DW solution such as Snowflake, a Databricks Lakehouse, or Redshift.
If you already understand Data Mesh and Data Vault, I think you can take it from here. It might be that all you needed was to make the connection between the two disciplines. You could skip the rest of this blog and even the series. Otherwise, for the rest of this blog I provide:
- The agenda for Parts 2 though 5, each part corresponding to a major phase, as shown in Figure 2 below.
- The importance and benefit of Domain Models. Without a model, we just have data. We often forget that models live in our heads, but computers don’t have those models, nor does everyone have the entire model in their heads. Think of the analogy of a group of blinded people feeling different parts of an elephant.
- The pain that hinders delivery of an enterprise-wide big picture for analysts that is addressed by Data Mesh and Data Vault. This is why analysts and managers don’t have a full model accurately reflecting the enterprise.
- Light background on Data Mesh and Data Vault.
Event Storming through the Data Mesh – The Full Journey
Data Mesh and the Data Vault Methodology are highly inspired or highly compatible to Domain-Driven Design. In fact, Data Mesh is often referred to as the analytics counterpart to DDD. The most salient aspect of the inspiration is the decomposition of monolithic systems into coherent, independent, functional components then defining relationships between them into a model of the system. Very roughly speaking:
- The big driving factor of DDD, microservices, Data Vault, and Data Mesh is to facilitate the ability to embrace change in software systems. This is as opposed to real-life workarounds in order to appease the computer systems.
- The DDD notion of domains and/or bounded contexts come into play in Data Mesh as the partitioning of the Domains owning the development, operation, and maintenance of Data Products.
- Data Vault satellites (related attributes – column families) can somewhat map to data in each microservice. If the underlying OLTP environment is not one of nicely decomposed microservices, the Data Vault would play the part of an abstraction between the tangled OLTP data sources and a nicely decomposed schema.
Because of that, I’m starting this particular journey to Data Mesh from the beginning: Event Storming. That is the activity of tearing down the workings of an enterprise into its elemental events and assembling it into domain models. So for this blog series, we’ll pretend we’re starting from the very beginning. Not just the beginning of the OLAP-side Data Mesh, but from a greenfield, big-bang OLTP overhaul.
Figure 2 somewhat outlines the high-level structure of this blog series. Note the blue arrows indicating transitions from level to level. From the bottom-up, the sections are:
- Part 2 – Event Storming to Domain Model – Decomposition of an enterprise into a set of types (entities, things) and functions (the things the that happen between the entities). These are the pieces of the 1000-piece jigsaw puzzle from which a domain model is assembled. In turn the set of OLTP-side microservices are derived from the domain model. ETA: 4/20/2022
- Part 3 – Domain Model to Data Vault. The domain model, done properly, should naturally translate well into the hubs, satellites and links of the OLAP-side Data Vault. ETA: 4/30/2022
- Part 4 – ETA: 5/30/2022
- a – Data Vault to Data Marts (Business Vault) – This is the point where the representation of data that still bears resemblance to the OLTP side transforms to the OLAP side as star-schema-based data marts.
- b – Data Marts to OLAP Cubes – The Data Marts are presented to the consumers in a manner as optimized and user-friendly as possible.
- Part 5 – Data Product Composition – This is the can that keeps getting kicked down the road. Sound integration of data across diverse data sources is a very painful process. That is what I consider the “hard problem” of Business Intelligence. ETA: 6/10/222

I’ve already discussed Parts 2 and 3, Event Storming to Domain Models and Domain Models to the Raw Data Vault, respectively, in the DDD/DVM blog. However, in this blog series, I chose to use Python instead of F# for the domain model. Python is familiar to magnitudes more programmers, is supplemented by thousands of packages, and the rather elegant “reflection” capability facilitates relatively easy development of automation scripts.
The meatiest part of this blog series is Part 4, Data Vault to Data Marts. This is a transformation of data schemas that still somewhat resembles the OLTP schemas serving workflow use cases to schemas that serve exploratory analytics-focused use cases.
The gray arrows between the Business Vault and Data Products layers (Part 4b to 5 in Figure 2) illustrates that what is presented to the consumers could optionally be pre-aggregated cubes. They are optimized versions of the star schema Data Marts. I discuss this in my blog, Kyvos SmartOLAP cubes as the customer-facing layer.
Domain Models
Before a very light overview of Data Mesh and Data Vault, I’d like to take a step back to elaborate on what I feel is the most profound implication of a Data Mesh implementation. That is, an integrated and evolving enterprise-wide model – usable by people and machines.
Intelligence doesn’t exist by computation alone. Computation occurs within existing systems from which we abstract coherent models. That would be the untangling a legacy big ball of mud. Or it could be the other way around where we’ve designed a model and built the system.
A model is a set of relationships describing a system. That’s what is in your brain, a model of the world built through all that we’ve experienced. For the most part, the richer, organized, and malleable the model, the better the quality of our decisions.
For decision makers and strategists in an enterprise, decisions and strategies can’t be made without a clear and up-to-date model of the enterprise and the ecosystem in which it is engulfed. Fortunately for the business, parts of the enterprise-wide model are scattered throughout the brains of all the folks working in the enterprise. That is the skill and knowledge we require to fulfill our job roles and interact with the folks in other job roles. With the collective model fragments, our enterprise manages to function.
But we’ve built our enterprises and the surrounding ecosystem to a scale dangerously bordering on (sometimes exceeding) the capacity of our brains. We need assistance, which stems from our data systems that records the details of so much that goes on.
The holy grail for analytics is to build an evolvable model of the enterprise, consumable by people and machines, from which we can base high-quality decisions.
As I just mentioned, the quality of our decisions depends on the quality and scope of the model in which we base the decisions. So the ultimate goal of a data analytics platform is to form and maintain a model of the enterprise from which wise decisions are made and strategies are devised.
The problem is that analytics systems so far fail to provide an enterprise model. Attempts either end up as fragmented silos or an unmaintainable, incoherent, big ball of mud. Both Data Mesh and Data Vault are guidance towards a well-balanced model of our complex enterprise systems.
A Little Disclaimer
In case this is the first Data Mesh resource you’ve encountered, I need to clarify that a Data Vault is just a layer within a pillar (self-service data as a platform) of a Data Mesh. There are four pillars of Data Mesh. The other three pillars (self-service data as a platform, domain ownership, data products, and data governance) are a much bigger story well beyond the scope of this blog.
Data Mesh Learning is a great source for getting started on your Data Mesh journey.
Like any buzz-worthy thing, Data Mesh isn’t a silver bullet. It’s the guidance towards balancing a few extremes that are perhaps counter-intuitive and even risky actions. We take the risks because we’re enticed with the reward of a genuinely effective and readily maintainable analytics platform.
At the time of this writing (Dec 2021), Data Mesh is not exactly “fully-baked”. The core principles laid out by Zhamak Dehghani are there, but interpretations and implementations out in the world are a little too disparate. Many early-adopter enterprises have recognized its fundamental wisdom and already implemented it in many different ways. Data Mesh hasn’t yet converged into a “methodology” as has Data Vault 2.0.
With that said, a little disclaimer, reminder: This is just my interpretation of Data Mesh.
The Pain of Data Integration
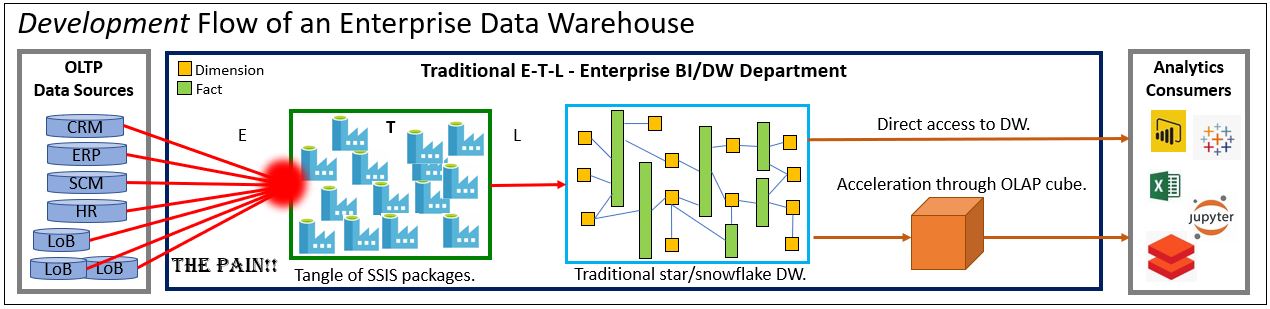
Figures 4 and 5 depict two eras of the Analytics evolution over the past couple of decades. They are the centralized Enterprise Data Warehouse and the Data Lake, respectively.
The EDW’s point of pain was the burden on a centralized EDW/IT team of techie specialists of the integration across many domains. Prior to the Data Lake, data from a heterogeneous array of sources were funneled into a centralized/monolithic Enterprise Data Warehouse (EDW). The painful red spot in Figure 4 depicts the pain of merging that heterogeneous data into generalized and standardized terms.
By “generalized” I mean we categorize like things under a standardized umbrellas. For example, revenue can be from sales of hardware, software license fees, support fees, or interested earned by the fat stack of license fees. “Elderly” customers in one database are “Seniors” in another. By “standardized”, I mean we settle on common definitions. For example, when we say profit, we have a very specific formula. Or, what you call “patient” is what I call “member”, and we call them “Party”.
The bulk of the pain stems from the reliance on highly-specialized techies directly encoding that generalization and standardization. They aren’t specialists of the dozens of domains. Without some level of understanding of the subject matter, there will be things lost in translation between the data producers (subject matter experts), the EDW folks, and the analytics consumers. Those misunderstandings result in months or years of scrapped work, technical debt, and worst of all, misinformation.
To further drive home intensity of the pain, although I drew seven OLTP data sources in Figure 4, a typical enterprise usually comprises dozens of applications, each with their own databases. Even worse, most enterprises import and export dozens to thousands of data objects from vendors, partners, 3rd parties, governments, etc.
Many of my fellow data engineers tell me “data is data”. It’s true to an extent. But so are words just words. Imagine producing a video on philosophy for an audience of philosophers using a director with little knowledge of the subject. I believe it will be hard to argue against a director who happened to be a philosopher producing a better product than a director with no background in philosophy. Well, at least the project would be less painful to produce.
The other main issue was the relatively immature state of hardware back in the 2000-2010 period. The old scale-up SMP servers scaled up in price in a non-linear fashion. For example, if data processing and storage doubled, the cost of an adequate, already expensive, single SMP servers quadrupled. Additionally, the state of the tools market and availability of experienced technical folks didn’t keep up with the growth of the BI world.
Resolving the Scalability Problem with the Data Lake
With scale-out data lakes, the idea is to dump everything into a highly scalable and centrally accessed place (a Data Lake in a Data Center). That relieves most of the volume scalability burden (technical and financial) off the EDW team. They now focused more on the E and L of ETL (Extract, Transform, Load) and renamed it to ELT.
By shifting the transform part to last, much of the burden of data integration shifted to the analytics consumers in the name of self-service BI. With access to all data, the analytics consumers can perform transforms (the T in ETL or ELT) in their own time, in their own way.

Analytics consumers of various classes could perform various types of transformations. For example:
- Data Engineers could clean and merge very large volumes of data into “silver” data (roughly Databricks’ term for cleansed data). This task would be beyond the technical capabilities of the usual analysts.
- Data Scientists could automatically segment a very long list of customers, using data from across multiple domains, into cohorts that could be targeted in optimized ways.
- Analysts could create simple models without the help of IT using the powerful self-service features of Power BI or Tableau.
- App developers could implement “embedded BI (or AI)” into apps for Information workers.
- Autonomous ML models could reference highly-curated values as input for context.
Dumping all data into a data lake is a centralized and enterprise-scoped solution. Meaning very techie people make a wide array of data readily available to non-techie consumers. But without any form of organization, it’s a massive slurry. At the risk of pushing the data lake analogy too far, the consumers troll around fishing for data.
The pain simply shifted from the left side to the right side of Figure 4. The hard problem of integration persists, simply punted downfield for the consumers to somehow deal with. However, at least the analysts had data to work with.
The Data Mesh
Data Mesh brings us a big step or two closer to resolving the pain of integration. It begins by disrupting the traditionally centralized/monolithic mentality of an EDW. Instead of a funnel into one big EDW or Data Lake, we partition into domain-level pipelines along domain boundaries, producing and exposing highly-curated domain-level Data Products to the consumers. Each Data Product is developed and maintained by a cross-functional, domain-level team of folks dedicated (for the most part) to their respective Data Products.
This resolves the pressure on a centralized team of data warehouse engineers dealing with a multitude of data sources of different contexts. Figure 6 depicts a possible Data Mesh deployment, simpler than the one in Figure 1. The three domains produce and expose data products (those hexagons) to a variety of consumers.

At the very least, the Data Products presented to the analysts are developed and maintained by domain experts who are actually intimately knowledgeable of the data. They are also directly vested in ensuring its security and quality. This is as opposed to throwing everything over the fence onto an over-worked IT team with no real expertise of the data (Figure 4). Or just dumping the data into a data lake and letting the consumers loose on it (Figure 5).
Each domain product is owned by a cross-functional team consisting of data engineers, data stewards, domain subject matter experts, and lead by a Data Product Owner. A data product is a product, not a project. So the team is responsible for SLA/SLOs assigned to the data product, as it would be for the vendors of any other product.
Data Products could be thought of as the old departmental, subject-oriented data marts of the Kimball methodology. The problem with Data Marts is that they are silos of information – which is why they variable entities are “conformed” (square pegs into round holes) into the generalized dimensions of a big EDW.
The intent with Data Mesh is to link the data products to form a wide-view model, but in a “composed”, loosely-coupled manner which is drastically more maintainable than a big ball of mud. The difficulty or inability to compose departmental or subject-oriented data marts/products into an integrated view has been the “hard problem” of analytics since the beginning (at least to me). It’s the subject of Part 5 of this blog series – Data Product Composition.
Each Data Product should in itself be valuable. In fact, it’s probably the case that the domains that create the Data Product are the primary consumers. Domain-level data products would certainly contribute towards domain optimization. Such “eating their own dog food”, lends itself to a convenient partial “unit test” of the data product.
In my opinion, it’s not that no one thought of the concepts that comprise the Data Mesh before. Ten or so years ago, scale-out databases weren’t readily available, hardware was limited, there was no Cloud. Master Data Management, DevOps/CI/CD, metadata management, data marketplace, data governance, the maturity of Notebooks and Python, and machine learning weren’t yet really a thing.
Data Mesh couldn’t work without all of that in place today. None of those things alone can stand out as the single key to it all. This is especially true for the issue of data product composition I’ll address in Part 5.
Note: I did develop collateral (software and tons of documentation) around an SSAS-focused solution back in 2011 named Map Rock. Unlike Data Mesh, it didn’t take off. But I did write something commemorating Map Rock’s10th anniversary.
Much of the pain experienced with EDW or Data Lake will be significantly mitigated thanks to those technologies that enable such a thing as a Data Mesh architecture. However, as is often the case, easing pain one place creates a pain somewhere else:
- Very much disruption of IT. It’s pretty much 90 degree turn.
- Data engineers re-inventing their skill stacks.
- Most likely requiring at least some level of increased head count for Data Product team members, especially data engineers and data product owners. In many cases, the roles of existing employees could be repurposed.
Data Vault Methodology
Since Data Vault doesn’t come into play until Part 3, for now, it’s enough to know that the Data Vault structure is a kind of data warehouse structure. It’s an advancement of the workhorse star/snowflake schema. It lends itself well to an enterprise consisting of lots of diverse moving parts (i.e. domains). The prime benefit of the Data Vault Methodology is enabling disparate domains to easily add their data to a central but tidy and malleable source – via a strict methodology. The Data Vault structure:
- Is easily expandable from a schema point of view. To exaggerate a bit, when there is new data, add another satellite.
- Lends itself very well to DevOps/CI/CD since the strict methodology is conducive towards automation.
- Lends itself very well to scalable parallel ELT processing.
- The tables are highly partitionable in the Big Data way.
Figure 7 illustrates a very small Data Vault consisting of three linked hubs and a collection of satellites from two lines of business. A total of twelve tables. The blue hubs are “concepts” such as Customer, Product, Employee, etc. The yellow boxes are satellites, each a column family of related attributes.

In contrast, a traditional star schema version would consist of three dimension tables and one fact table – the three hubs combined with their satellites and the link, respectively. The increased number of tables may at first glance seem like a bad thing. But it’s a situation where we take a step backwards to take two or more steps forward.
Figure 8 illustrates that the Data Vault provides more structure than the fully open “schema on read” data lake on its left. At the same time, it’s more flexible than the easily understood but rigid snowflake/star schema on its right.
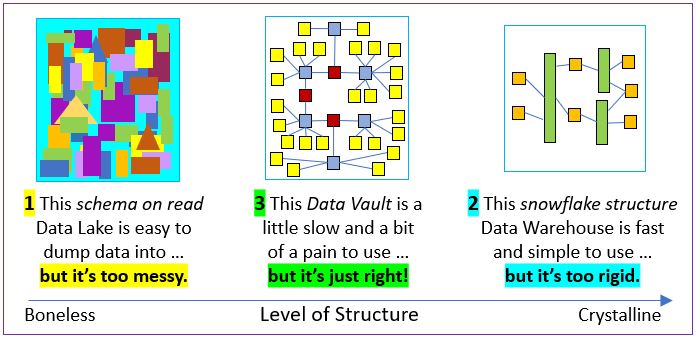
The quality of a simple underlying structure is the common theme for domain-driven design, data mesh, and data vault. That goes for Legos and atoms as well.
Data Vaults do result in an increased number of objects such as tables and ETL/ELT packages. However, as mentioned above, the main idea is that since the data vault follows strict methodology, most of the development and maintenance can be automated. In fact, it’s almost an imperative that Data Vaults are managed through specialized tools from vendors such as dbtVault, WhereScape, and Erwin.
That’s a very good thing since Data Mesh also results in a significant increase of parts. Since the Data Vault plays such a large part in this blog series, the automation of the Data Vault dramatically increases the overall automatable portion of the Data Mesh. Additionally, the spiffier Business Vault is built from the raw Data Vault. So the transforms are also known to the automation tool.
The Data Vault Methodology is a big subject. As it’s been around for about 20 years, there is much written about it. As I mentioned, I’ve introduced Data Vault in the DDD/DVM blog – along with many chosen reference links.
On to Part 2 – Event Storming to Domain Model
In Part 2, we begin the journey with an Event Storming session resulting in a Domain Model. From that Domain Model, we will build a Data Vault (Part 3).
Please do check out my two Kyvos blogs on the role of pre-aggregated, Cloud-scale OLAP cubes with Data Mesh and Data Vault:
- Data Mesh Architecture and Kyvos as the Data Product Layer
- Data Vault Acceleration with Kyvos’ SmartOLAP
© 2021-2022 by Eugene Asahara. All rights reserved.

Note on 4/12/2022: I’ve run into a lot of new items on my plate recently. Parts 2-5 are written but require editing. So the release is delayed yet another month.
Kent Graziano from Snowflake just posted an article on this same idea: https://datarebels.com/datavault/data-vault-and-data-mesh/
Part 2 to 5 is not published yet?
Hi,
Thank you for reading.
When I wrote this blog a couple of years ago, all of the parts were written. I just needed to edit with limited time. By the time I got to it, things changed (ex. the incredible progress of dbtVault, functional programming didn’t take off as much as I’d hoped, and of course, LLMs the next year) requiring lots of rewrite.
I do hope to get the rest posted. But this first part contains the meat of what I wanted to say.
Take care,
Eugene