This is my final post for 2025, just in time for your holiday-season reading, ideally from a comfy chair next to the fireplace. It’s food for thought for your 2026 New Year resolutions. So toss out that tired old “‘Twas the Night Before Christmas” and read this new tale to the kids and grandkids.
✨🎄🔥📚☕❄️🎁
Happy Holidays!
If you’ve found your way here, you’re probably the kind of reader who doesn’t mind wandering into the esoteric weeds now and then, entertaining ideas that are a little off the beaten path. If so, I hope this gives you something interesting to ponder for a potentially wild 2026.
✨🎄🔥📚☕❄️🎁
This lengthy blog follows an SBAR flow. For most, I think getting through just the situation would be helpful:
- Situation: Introduction—Planning is what sets human intelligence apart from that of other creatures. Intelligence evolved to engage successfully and proactively in a complex environment. This is the problem we’re trying to solve, which might not be valid.
- Background: Planning Function—This topic is the first in a series of topics providing background required for analyzing (3) a recommendation (4). This blog is about how many moving parts (see Figure 1) integrate, so it’s necessary to provide background on each.
- Analysis: Planning Process—What does the process of planning require? How can we automate and reduce the complexity of planning.
- Recommendation: Game of Dōh—The solution. An enhanced strategy map that defines the problem environment and searches for solutions to achieving goals.
Introduction
Planning is an intelligent process, a verb, just like querying and reasoning. It organizes items, intelligent and not, other resources, and constraints into a sequence of events that meets desired goals.
This is an exploratory blog where I present thought around the aspect of planning, inspired by the ensemble centered around the prefrontal cortex. But I “ground” it to a combination of a strategy map and the Configuration TradeOff Graph. My intent is to provide serious food for thought to go along with all literal food and treats during this 2025 Holiday Season. We’ll dive deeper into in the New Year. But
Remember, I’m not a neuro anything (neuroscientist, neurologist, etc.). I know data, how enterprises operate, how analysts make the best use of it, and the ways utilization of the data has been tedious. Forgive me for “swimming outside my lane”, but it’s necessary to see a wider picture and notice solutions from other domains that serve as seeds of analogy.
This material of this blog is just an analogy that provides a framework analogy in which to develop a direction towards AGI. Analogies are meant to be broken—they are an existing pattern inspiring a novel solution to a novel problem, as I describe in my blogs: Analogy and Curiosity-Driven Original Thinking and Long Live LLMs! The Central Knowledge System of Analogy.
This blog is another part of my NoLLM discussions—a discussion of a planning component, analogous to the Prefrontal Cortex. It is Chapter X.I of my virtual book, The Assemblage of AI.
Navigating the World
All of our decision and actions take place in the context of life on Earth. What we know as our individual lives didn’t start out for us on a “blank canvas”—not like a blank laptop onto which an OS is installed, and apps and data on top of it. Every pixel of that blank canvas was filled and changed countless times over the past 14 billion years, give or take. We’re born and raised in the context of life on Earth.
At least at the time of writing, decisions we make are constrained by the laws of physics, the processes of life on Earth (the qualities of our inner planet and the crust), the culture in which we live, the cultures outside of our own, the resources available to us, what we hold dear to us that we don’t want to lose, and of course, the vision of what we’re hoping to achieve.
That’s a lot of constraints when you think about it that way! But it does mitigate (there’s no word to express how much) the complexity of planning.
For the most part, our lives and that of most non-human critters are reactive. We try to get from Point A to Point B, whether we’re talking about physical locations, a currently unsatisfactory state to a desired state, or even the journey of our lives. The bulk of those journeys are rather automatic iterations of this sequence:
- State: Is our current state blocking our journey? This is mostly recognizing what is around us and see if it maps to something familiar. For example, a doctor noticing symptoms.
- Analyze. What is the problem? For a doctor, this is the diagnosis.
- Plan. How can we remove the problem? For a doctor, this is the treatment plan. This is the subject of this blog.
- Execute the plan at the right time. Sometimes, the doctor can execute the treatment plan immediately, but maybe there’s a reason to hold off. For example, waiting for a complication to pass.
- Assess the outcome. Have we hurdled the obstacle and can move on? If so, we can continue on our journey. Otherwise, we go back to Step 1.
Planning (3) is often the most intellectually and creatively intensive part. Recognition of things (1) and mapping the things to a diagnosis (2) are usually common and “best practices” that could be applied with little creative effort. But this means the situation is fine for some sort of relatively simple machine learning model that correlates a diagnosis with a treatment plan and a positive outcome.
If the correlation between diagnosis, treatment, and outcome isn’t highly positive, we need to craft a clever plan—a novel solution to a novel problem. This demands multidimensional intellectual acrobatics, which is (as far as we know at the time of writing) in the realm of just humans and the evolutionary process of life on Earth, although the latter takes an awfully long time. Thirdly, if there is an almighty god, I think he wants to see us learn these things on our own.
Notes and Disclaimers:
- Code and large files related to this blog (Python, RDF/TTL, LLM prompts) can be found in the GitHub repository.
- This blog is an extension of my books, Time Molecules and Enterprise Intelligence. They are available on Amazon and Technics Publications. If you purchase either book (Time Molecules, Enterprise Intelligence) from the Technic Publication site, use the coupon code TP25 for a 25% discount off most items.
- Important: Please read my intent regarding my AI-related work and disclaimers.
- Please read my note regarding how I use of the term, LLM. In a nutshell, ChatGPT, Grok, etc. are no longer just LLMs, but I’ll continue to use that term until a clear term emerges.
- There are a couple of busy diagrams. Remember you can click on them to see the image at full resolution.
The Intelligence of a Business
My book, Enterprise Intelligence, was originally titled, The Intelligence of a Business. I meant that an enterprise, a business, is like an organism. To paraphrase Stuart Hameroff when he is speaking of single-celled creatures, it eats, metabolizes what it eats into products, reacts to pain, reproduces, avoids its predators, and can even die. In fact, corporations share many of the privileges and regulations of we sentient people.
When I look at intelligence from an enterprise point of view, I don’t mean to say that I’m necessarily interested in only how AI is applied there—for example, using it to deal with first-tier support calls or write code and presentations. I actually see the intelligence of an enterprise as what we’ve developed over the centuries to optimize the performance of businesses.
All the time we’ve created accounting, tools, automation, scale-out methodologies, software applications, business intelligence, ERP, SCM, CRM, business performance management, business process management, and a whole lot of other “three letter” initiatives, we’ve been creating an artificial intelligence at the level of a “corporate organism”. It’s unnatural for us to see that since we people live within that intelligence—looking out from the inside.
Figure 1 is a very high-level perspective (meaning chosen pieces to stress a particular aspect as opposed to fully comprehensive) on an enterprise-inspired intelligence. I brought up this map early-on in this blog as a map you can refer back to as you peruse this lengthy blog …. or even as a TL;DR.
There are two sets of labels on Figure 1. The first are the red circles with numbers which label the concepts. The second set are the purple, dashed circles with alphabets. These are the relationships between the concepts.
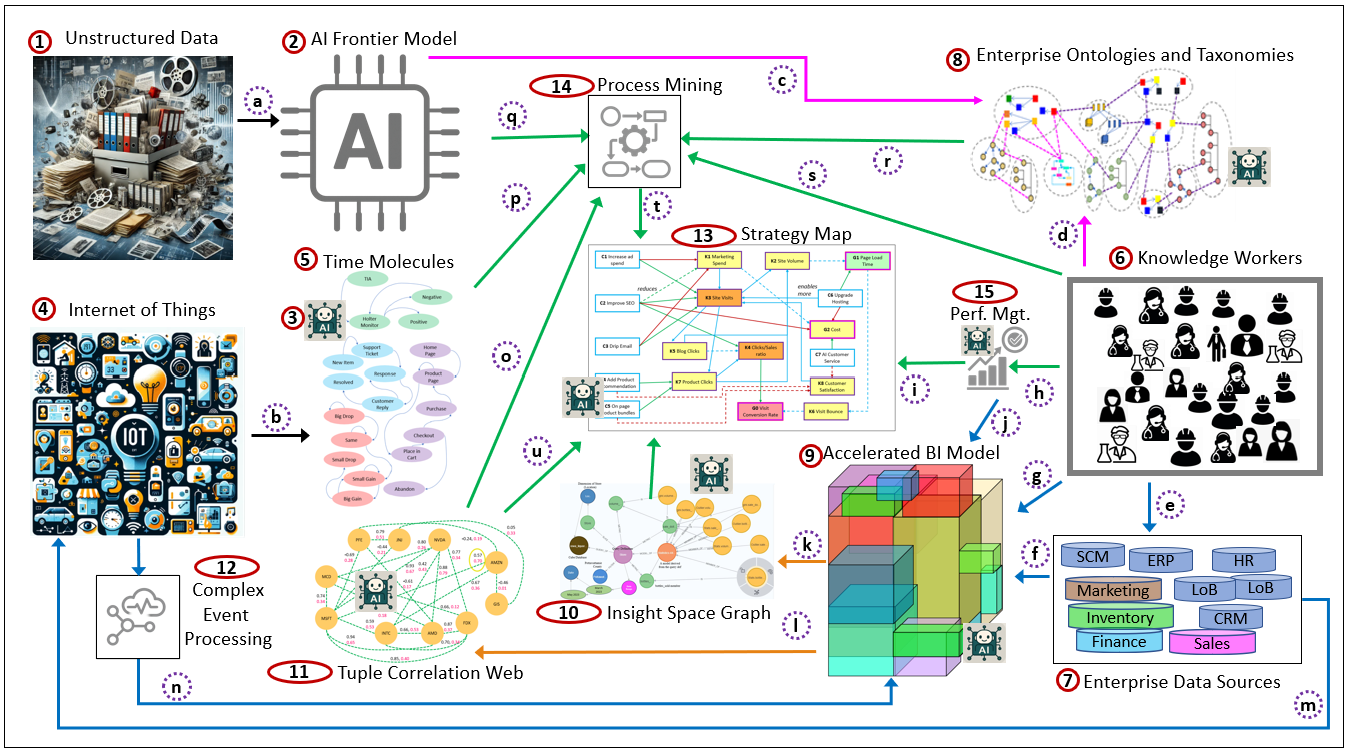
Here are the descriptions for the first set, concepts, the red-circled numbers:
- Unstructured Data: This is the corpus of recorded human knowledge. Ranging from ancient texts to social media posts, from ancient art to videos. This is the data used to create frontier LLM models.
- AI Frontier Models: These are the LLM-based AI of today such as GPT, Gemini, and Grok. It tears apart and restructures data (1) into a monstrous summary of human recorded knowledge. The result is what is like your know it all friend who knows a lot about a lot of things, and is able to research the latest very quickly.
- AI Agents: In the context of this blog, these AI agents are the interface between the frontier AI models and a component. Each icon represents the agent responsible for the component it’s nearby. They are specialized to their adjacent components. They have consumed the data, have been fine-tuned with skills to understand and process that data.
- Internet of Things (IoT): Billions or even trillions of devices around the world. Some just take readings and some perform tasks. But all of them emit events that tell us what’s going on. These can include sensors, personal devices (phones), even AI Agents. However, this really represents a central event hub which picks up signals from multitudes of devices.
- Time Molecules: Temporal patterns of events Time Molecules capture the probabilities and timing of event sequences—essentially Markov models enriched with event intervals, variance, correlations, and context. They tell us what tends to happen after what, and how long transitions usually take. They are the memory of the system, formed directly from event histories.
- Knowledge Workers: Human workers who require access to knowledgebases during the normal course of work. This includes practically everyone. With the advent of mobile devices, the cloud, and AI, ready connection to knowledge sources is feasible for practically every job.
- Enterprise Data: This is the traditional databases that support software applications deployed throughout an enterprise.
- Enterprise Ontologies and Taxonomies: A knowledge graph of descriptions of classes of things in an enterprise, how they relate to each other. This is an implementation of the W3C semantic web. With the help of frontier LLMs (2), it’s much more feasible for knowledge workers (6) to lay out their domains in a format that is explicit and readable by humans and machines.
- Accelerated BI Model: This is a highly-curated enterprise-wide semantic layer that presents enterprise information in a manner that is readily usable for analytical purposes. Considering the proliferation of AI agents and growing populations of knowledge workers as BI consumers, this acceleration is a critical component. In practice, it’s what allows BI, analytics, KPIs, processes, and AI to speak a shared language. Please also see my blogs on Kyvos Insights, The Role of OLAP Cube Concurrency Performance in the AI Era and The Effect of Recent AI Developments on BI Data Volume.
- Insight Space Graph: A structure described in my book, Enterprise Intelligence.
- Tuple Correlation Web: Another structure described in my book, Enterprise Intelligence. It stores correlations between tuples of information.
- Complex Event Processing: Events received from IoT devices and other sources (such as enterprise applications) are collected in a central event hub (4) where simple preliminary transformations (simple cleansing, aggregations) are performed, and that versions is presented to interested applications.
- Strategy Map: This is really the focus of this blog. Relationships among event-driven outcomes A strategy map shows how configurations (actions we can take) influence KPI states (event-derived measurements) and how those KPI states connect to goals and risks. It’s the high-level navigation chart: pull this lever → these events change → these KPIs move → this goal improves (or breaks). It tells us how the system responds when events accumulate.
- Process Mining: A discipline and set of techniques that reconstruct how work actually happens by analyzing event sequences emitted by systems, people, and devices. Process mining discovers real process flows, variants, bottlenecks, delays, loops, and deviations by observing event order, timing, and frequency—rather than relying on documented procedures or intended designs. In this architecture, process mining sits between raw event streams (IoT, enterprise applications) and strategic reasoning: it converts observed behavior into explicit process structures that can be measured, compared over time, and used as input to strategy maps and planning. It reveals not only what processes exist, but how they evolve, where friction accumulates, and where intervention is even possible.
- Performance Management: A continuous, closed-loop system for monitoring the health of goals, KPIs, and risks, and for guiding corrective action when performance drifts into pain. Performance management does not merely report metrics; it interprets them in context, evaluates trade-offs, and prioritizes interventions across competing objectives. In this framework, performance management consumes KPI states derived from events, correlations, and processes, and expresses them in normalized status signals (pain levels) that feed directly into strategy maps. It is the governing function that decides when a deviation matters, which levers are safe to pull, and whether a proposed change improves the system without breaking something else. In biological terms, it plays the role of homeostasis—keeping the system viable while it adapts.
Here are the descriptions for the second set, the relationships between concepts, the dashed purple circles with alphabets:
- Massively broad in domain, multi-model, and comprehensive unstructured data is the raw material for creating a “frontier” large language model.
- Similar to the massive, broad, multi-model unstructured data of LLMs, the billions to potentially quadrillions of devices emitting data that could be captured (wirelessly or otherwise) is the raw data of Time Molecules.
- Frontier AI models—the know-it-all friend who knows a lot about a lot of things but can’t reliably read your mind perfectly—provide fantastic assistance to knowledge workers in documenting knowledge in a precise manner.
- Knowledge workers express their knowledge in a format that is more precise than language.
- Knowledge workers use (and therefore instigate changes in) software applications that leverage and change data.
- The data from enterprise applications is formatted into accelerated dimensional models that are user-friendly, highly curated, and magnitudes faster to query. This pretty much represents ETL (Extract, Transform, Load).
- Knowledge workers query the accelerated dimensional model as a primary source for analytical tasks.
- Knowledge workers apply their analytical work toward the optimization and maintenance of the enterprise through a performance management process.
- The highest-level product of performance management is the strategy map, a form more powerful than the traditional balanced scorecard. Note the path from the IoT (4) to the ABIM (9) via relationship m. That involves events that are outside the realm of enterprise applications (7).
- KPI metrics (value, target, trend, status) are emitted to the accelerated dimensional model as facts that can be incorporated.
- The accelerated dimensional model is the primary data source for the creation of the Insight Space Graph.
- The accelerated dimensional model is the primary data source for the creation of the Tuple Correlation Web.
- The enterprise applications (7) are constantly emitting events, application to application, an enterprise event hub, etc. These are events, although the emitters aren’t necessarily “IoT” devices. They are events, nonetheless, and are submitted to a central Event Hub (4).
- Events passed through the CEP (12) application are submitted to the accelerated BI model (9) as “facts” about things going on in the world. Please see my blog, Embracing Change with a Wide Breadth of Generalized Events.
- The TCW (11), in combination with Time Molecules (5), provides important information about processes. The source of this process information does begin with the IoT (4), which passes events to the Accelerated BI Model (9), which generates correlations found in the TCW.
- Time Molecules (5) is a source of events from the IoT (4) that are the fundamental starting point for process mining (14). Note that events from enterprise applications (7) are incorporated into the IoT (4).
- The know-it-all frontier model (2) participates in process mining in many ways. It can help with ideas about what a process discovered from the IoT (4) may be.
- The enterprise knowledge graph (8) can be used to provide more context about labels and properties from the IoT (4) and knowledge workers (6).
- Knowledge workers (6) participate in process mining.
- The main output of process mining (14) is used as material for the construction of a strategy map (13).
- The TCW (11) is used to provide correlations between metrics of the strategy map (13).
Honorable Mentions and Deliberate Omissions
There are many important ideas that hover just outside the perspective presented in Figure 1, not because they’re unimportant, but because including them would have expanded the scope beyond what this blog is trying to do. These are the three most important:
- Agile Project Management is all about adapting to changing circumstances. The problem it solved is by the time a monolithic, five-year project completes, the world has already moved on, and we may even find we didn’t really understand what was needed. Agile project management breaks a big project into a series of mini-projects, usually two weeks long, with clear objectives. At each conclusion, the results of the mini-project, understanding of the overall goal, and a reality check conceptual overall plan are reassessed.
- Data Mesh and Data Vault are critical scale-out patterns for managing enterprise data at size. They address ownership, lineage, resilience, and long-term historical truth in ways that strongly support everything discussed here.
- An enterprise-wide data catalog—what I’ve often described as an enterprise-wide data catalog—is foundational and by now a no-brainer. I’ve written about it extensively in Enterprise Intelligence and in the many of blogs since its publication. Conceptually, it plays a role very much like the thalamus in the brain: a hub through which nearly all structured information passes, is normalized, contextualized, and made available to downstream systems. This is similar to the Accelerated BI Model (9 in Figure 1). But not everything makes it into the BI model as the work to map the connections (ETL/ELT) is substantial (Data Mesh and Data Vault mentioned above address that). This data catalog is simply a repository of all data source metadata without the need to map it.
The Planning Function
Planning could lay a claim for being the epitome of intelligence. I don’t know because we’re not even certain about what intelligence is. What I do pragmatically believe is that no other species or mechanism that we know of can plan as well as humans. But then again, as Mike Tyson says, “Everyone has a plan until they get punched in the face.”
However, since everyone uses that quote these days, I’ll paraphrase a new version: “Every rollout passes UAT until it goes into production.”
Planning is fundamentally about arranging actions—people, time, and resources—into something that moves us toward a result. But that “something” comes in two very different forms.
- A project is a one-off arrangement of actions built to achieve a specific goal only once—although it could be fine-tuned into a repeatable process towards achieving the same goal elsewhere and/or serving as an analogy towards solving a problem that seems somehow familiar. It has a beginning and an end. It’s full of uncertainty, iteration, re-thinking, and improvisation. We plan projects when the goal is unique, when the landscape is shifting, or when we simply don’t yet know the full path.
- A machine or design, on the other hand, is a perfectly repeatable arrangement of actions. It takes the same ingredients—people, time, and resources—but freezes the sequence so it can be run again and again for the same purpose. A machine is basically a successful project made permanent. The risks are known, the steps don’t need to be re-argued, and execution becomes routine.
A plan is an organized set of tasks towards achieving goals. Notice that I say “plan” in the singular, but goals in the plural. The complex world in which we live is fraught with competing goals and a plan must not solve a targeted goal while breaking others. The classic business example is growth and profit. It’s such a tough trick to pull off that most companies take on one at a time. There is a period profit is sacrificed for growth and other periods where growth is sacrificed for profit. Both phases could lead to bankruptcy—the former simply because we’ve spent all the money building the business and the latter because we lost all the customers due to cuts to product quality.
But there are ways to have our cake and eat it too, as Rockefeller proved with the ingenious vertical integration to push down costs which enabled profit followed by growth through horizontal integration at all levels. Microsoft did it as well by finding a way to sell very many units of a product which is very inexpensive to produce. These circumstances are rare because they require special conditions such as an oil and PC boom which are hard to find, especially with billions of other people striving to succeed.
The Internet was a bubble, but not like many bubbles. The Internet got caught up in a whirlwind of hype, but within a decade or two, it did pretty much fulfill the hype—albeit not exactly as anyone would have predicted. Whether AI turns out to be a bubble and pops within the next year or two remains to be seen. If it does, I expect it too will eventually live up to the hype.
The Internet does come with several flavors of terrible privacy issues (easy to track people, identity theft, scamming), and AI will amplify those capabilities.
There are the regulations that control balance (at least that’s the gracious way to put it). Rockefeller’s Standard Oil and Microsoft faced the dreaded regulatory process. Fortunately, it can take regulators (and even competitors for that matter) some time to see the act on a good thing, giving entrepreneurs a window of competitive advantage.
I’ve described inventive strategy, tactics, iterations (different phases of a plan), known consequences to avoid (risks), and unintended consequences (risks we didn’t know we didn’t know). Of course, what might get written in the history books sweeps much of the role of luck under a rug—instead telling a tale of intent. Luck is what folds complexity into the mix. It’s a combination of probability and unintended consequences.
Real Artificial General Intelligence
I feel like the definition for “genuine AGI” unfairly requires the AI to learn all the rules in an unsupervised way—the argument being that human intelligence itself isn’t AGI. Meaning, no humans are involved—just like lions, tigers, and bears that learn to successfully hunt without human guidance. They implicitly learn a lot from playing with others in a randori sort of way. But wait, they are still tutored by their parents, shadowing and mimicking their parents. More specifically, they are self-supervised (leans more towards unsupervised than supervised). For example, they can assess their skill and methodology through feedback from internal hunger drives. Hungry? Not doing well. Not-Hungry? I must be doing it right, so keep improving in that direction.
As Ilya Sutskever said on his November 2025 appearance on the Dwarkesh Podcast (episode on SSI strategy and generalization at 47:48):
“The term AGI, why does this term exist? It’s a very particular term. Why does it exist? There’s a reason. The reason that the term AGI exists is, in my opinion, not so much because it’s a very important, essential descriptor of some end state of intelligence, but because it is a reaction to a different term that existed, and the term is narrow AI. … So in response, as a reaction to this, some people said, this is not good. It is so narrow. What we need is general AI, an AI that can just do all the things.”
A genuine AGI should be able to figure out relationships all on its own without cheating with human support. But that’s not really fair since no human has performed that trick. Not only Newton “saw further by standing on the shoulders of giants”. All of us have, reaping the hundreds of thousands of years of knowledge, understanding, and wisdom presented to us as human culture.
It seems to me that fully defining human intelligence starts from the start of life on Earth, not from the training of a newborn human baby. Even though our human intelligence is substantially aided by humans who pass down knowledge generation to generation, we learn how objects collide, fall, and rise in a 3D space through observation, before we understand the words of our teachers. Those skills are universal for any creature living on Earth, so really, they only need to be learned once and installed on every instance of an AI—I think Tesla and xAI seem pretty well set with work on robots and AI.
However, I don’t believe hominids could have built our level of intelligence without communication with others. That is, to have worked as a distributed team, like a pack of wolves or orcas. That communication probably started with grunts and gestures but evolved into a syntax capable of more precision and expression of sophisticated concepts.
Symbolic Thinking and Syntactic Expression
When most people hear “symbolic thinking,” they picture language: words, labels, categories, definitions, and taxonomies of things. But symbolic thinking happens before we ever put anything into words. A symbol isn’t a word per se, but a concept—which we might serialize into a word in order to communicate it to others. It can be a pattern, a bundle of relationships, a stable configuration of features, senses among thousands, and feelings. For example:
- A smell is a symbol long before we learn the word “cinnamon.”
- A color is a symbol long before we learn the word “blue.”
- A mental model of a situation is a symbol long before we describe it.
A symbol is not the label, but the internal structure that maps to a label recognized by others. Before language, infants learn concurrent combinations of sensed qualities such as smells, sounds, warmth, hunger, motion, discomfort relief. Those combinations of attributes are symbols. They are multidimensional relationship clusters that reliably predict something. Only later do we attach words to them.
Planning is the organization of symbols in our head. Planning is the manipulation of symbols in the safe convenience of our heads, requiring symbolic thinking, not verbal labels. To plan, you need something that can:
- represent situations internally as structured symbols
- imagine changes to those symbols
- project sequences of symbolic states
- evaluate consequences in symbolic space
None of that requires words or other labels (like a recognized icon or sound). It only requires internal symbols—relational structures representing meaningful configurations. Language is only needed when you communicate the plan to someone else.
Humans then have two symbolic layers:
- Pre-verbal symbolic thinking that is …
- Internal
- Multimodal
- Continuous
- Structured by relationships
- Like smells, shapes, forces, analogies, vectors of features
- This is the layer that plans.
- Syntactic expression (words, diagrams, math) that is …
- External
- Discrete
- Serializable
- Built for collaboration
- This is the layer we “talk to ourselves” in when we are preparing to communicate.
So when you “talk to yourself”, who are you communicating with? You’re preparing a translation from your internal symbolic model into an external symbolic code. You’re basically rehearsing communication with other humans or a system that expects discrete symbols (paper, code, diagrams, an LLM).
Internal symbolic thought is parallel and relational. External thought (verbal, syntactic) is serial and communicative. You use the second when you need to ship the idea.
In this paradigm, symbolic thinking is the manipulation of symbols, which is the Game of Dōh I introduce at the end. Syntactic expression are the rules expressed as Prolog which expresses facts usually in a subject-verb-object format and Boolean logic. Symbolic expressions are the labels and/or icons we assign to concepts. Markov Models (chains) represent sequences of events, which are like stories.
Alternatively, rules could be encoded using another method such as Azure Functions or Python functions in a Python library.
Why This Matters for AGI
I don’t think it was ever a requirement for AGI to be built the same way human intelligence was built. That is, completely self-assembled from exposure to data. There must certainly to other types of intelligence that might be not as good in our environment, superior in its environment, and even unrecognizable to us. But to bring up analogy again, human intelligence is the only one we’re aware of at this time that is at least at our level—and useful in our life on Earth. So it serves as our only analogy for intelligence. As I mentioned towards the beginning, my thesis is that we’ve been unwittingly progressing towards an artificial intelligence that might someday rival our human intelligence through the evolution of fit corporations.
As long as we don’t fully understand how human intelligence works, it still makes sense to use it as an analogy for building an artificial general intelligence. If we did fully understand human intelligence and building a silicon replica of the organic version is still short of AGI, then it only makes sense to look at a different architecture. Think of how we didn’t achieve useful flying machines by insisting on mimicking the flapping of bird wings. But for now, modeling human intelligence is still very fertile ground.
Lastly, although intelligence and consciousness are generally considered two separate, albeit adjacent issues, I suspect more and more that they aren’t separate. Composing a novel plan towards a goal, reacting to our sapient efforts during execution of the plan, and adapting the plan requires awareness, which is a partial synonym for consciousness.
Creation of Knowledge, From Wash to Source
One of my long-running hobbies is rockhounding. I live close enough to Utah, Montana, Nevada, and Oregon that good geology is always within reach. The fun part isn’t owning the rocks—I almost never buy any—but trying to figure out how they got where they are. It’s a planning exercise disguised as a hike.
When I’m out in a dry wash staring at a jumble of pebbles—igneous, metamorphic, sedimentary, all mixed together—I’m basically doing the same thing I do at work: trying to understand a process from scattered evidence. A green pebble here. A piece of obsidian there. Something out of place and worth chasing. That’s the clue, not the destination.
You can pick up interesting fragments all day, but they won’t tell you much until you trace them back to their source. Most washes collect debris from several tributaries, and the real story doesn’t reveal itself until you walk upstream. As the stones get larger and less rounded, or certain kinds suddenly disappear, you know you’ve crossed an inflection point—an indicator that you’re approaching the origin of the material. In planning terms, it’s like spotting leading indicators, bottlenecks, or phase changes. Cities might call it forensics; rockhounds call it a good day.
I never set out to become an expert. What I wanted was to understand how I learn and how decisions form when I don’t have perfect information. With no apps, no books in my pocket, just eyes, hands, and the little bit of geology I’ve picked up over the years, I have to make sense of things the slow way—and that slow way pays off. Every hypothesis I form in the field sticks far more firmly than something I read first and experience later.
Some simple rules always prove themselves:
- Big systems are layered. Multiple processes interact, and the result is what you’re seeing on the surface.
- Change has different speeds. Sedimentation, erosion, weathering, and drift all move at their own pace—and planning must respect those timelines.
- Metrics relate. “Farther upstream means larger stones” is just another way of saying variables correlate.
- Inflection points matter. A sudden shift in what you’re seeing marks a boundary in the system—something planners need to catch early.
Most of us are taught things first and apply them second. Rockhounding flips that: you apply what you think you know, test it, and only then confirm whether your mental model was right. It’s a good discipline for planning work because it forces you to operate without waiting for perfect data or a perfect diagnosis.
Anyone working in planning—strategy, analytics, process improvement—benefits from occasionally learning a skill the hard way. That’s the beauty of a hobby where there aren’t any consequences for being wrong. Skip the shortcuts—like bootcamps, and how-to videos. Throw yourself in and struggle, at least for a bit. Form your own explanations before you check them.
Speaking of “washes,” there’s another kind worth mentioning—borrowed from the world of watercolor in which my wife lives. Watercolor and oil painting take almost opposite approaches. Watercolor starts with broad, translucent washes and builds gradually toward definition. You can’t fully control where the water carries the pigment, and you can’t cover your tracks. Every earlier layer shows through and influences the final result.
Oil painting is different. It’s opaque. You can place an idea down in one stroke, adjust it, paint over it, and refine it as many times as your skill allows. The painter has much more direct control over intent.
Watercolor sounds closer to the way life on Earth actually works. However, both are beyond just the painting, but how it’s still caught in the gravity well of the psyche of people. The artist knows how to explore the fringes the psyche of people and express it in the syntax of their medium.
If you think about how humans learn versus how LLMs “learn,” watercolor comes closer to the way our minds work as infants. We start with big, blurry impressions—sight, sound, movement—layers of experience that stay visible underneath everything we learn later. Over time the watercolor artist adds progressively specific structure, gradually sharpening into something recognizable. The journey matters because every earlier layer forever influences the next.
LLMs learn the opposite way. They start with the “oil painting” already finished: clean, explicit, adult-level language—no washes underneath, no messy buildup of lived context. They inherit the final strokes without ever painting the underlayers.
Whether it’s geology or planning, the real value isn’t in the shiny outcome. It’s in the work you did to get the shape right. Within the “tree of washes” are partially explored branches that probably come in handy later on. Just as Alexander Fleming once overlooked a moldy petri dish gathering dust in his lab—only to recall it years later as the accidental genesis of penicillin, saving millions of lives—those half-explored branches in your tree of washes may one day bloom into the breakthrough that redefines everything.
Analogy of the Prefrontal Cortex
Before getting deeper into how we manage goals and objectives—executive function—remember that humans are unusually good at planning, relative to other seemingly conscious creatures like apes, whales, corvids, and octopi. Our superpower is that we have a mental system whose entire job is to hold multiple goals and moving parts in mind, imagine different futures, and choose a workable progression of steps across time toward that imagined future. All of those non-human creatures have some sort of other superpower we don’t have.
That human superpower lives primarily in front of the brain—the most recently evolved part—and it acts as our long-range strategist. Neuroscientists often point to the prefrontal cortex as the region most associated with coordinating complex, multi-step behavior. However, it’s important to remember that it doesn’t live in a vacuum—it’s not one structure but a small network of tightly connected areas that together let us juggle priorities, evaluate consequences, and organize actions across time.
This system is what lets us balance competing objectives, break big goals into smaller steps, avoid catastrophic moves, and occasionally accept temporary pain when it leads to something better. When people talk about “thinking ahead” or “keeping your priorities straight,” this is the machinery doing the work. It’s not an emotional system and it’s not a reflex system. It’s the part that keeps a plan coherent while the world keeps changing.
What’s interesting is that this ability isn’t tied to a specific piece of biology. Mammals perform these computations in the neocortex. Birds—who don’t have a neocortex—use a different structure, yet they still solve puzzles, use tools, and plan several steps ahead. Evolution built planning more than once, using different materials but the same underlying logic. In fact, a new video by Anton Petrov on this posted yesterday: Why Did Consciousness Evolve? Exciting Research on Bird Brains
And that logic is simple to state: Take competing goals, weigh their consequences, project possible steps, and choose a path that stays safe while still moving forward.
That is precisely the role I want my enhanced strategy map—the Configuration Trade-Off Graph (CTG)—to play in an artificial system. Instead of neurons, the CTG works with KPIs, configurations, pain levels, and trade-offs. Instead of imagining futures biologically, it evaluates the impact of changes across a network of goals. It doesn’t need to imitate the brain’s wiring—just the brain’s function: balancing objectives over time in a way that avoids bad paths and finds viable ones.
Planning is a universal computation. Biology implements creative solutions with genes (even though it’s a very slow process), birds with the nidopallium caudolaterale (as Anton Petrov mentioned), and with humans, the PFC. In the case of my work, it’s a strategy map and a semantic network perform the same essential task. That is, choosing a path through complexity.
Events
Senses are about detecting change. Events represent a change. A change in some context—a set of things and their relationships (in many dimensions). And those events are what plugs into the machinery of our brain towards making decisions.
Readings such as pinging a thermometer IoT device every hour might be the same, so there is no change. Instead, we can look as readings as verifying things are still the same in case we somehow missed a change. Some events are state changes while others are state confirmations.
Key Performance Indicators
Key Performance Indicators (KPI) usually present some metric. For example, for business it can include revenue, number of visitors, electricity bill. For a system, it can include fuel consumption, heat levels, and output rate.
There is a difference between key performance indicators and performance indicators. But for simplicity, I choose to collectively call the ones that make it onto a strategy map as KPIs.
I mention KPIs under the Events topic because they are generally a calculation of some sort of event measure, based mostly on counts and sums. A KPI might be a formula of the total counts of birds we’ve seen (each sighting is an event) in proportion to feral cat population over a period of time.
Performance Management for Human-Created Processes
In the enterprises that exist right now, the business processes were designed by humans. Business processes are the business as much as the systems of any creature is the creature. Performance Management is about monitoring health of the processes and managing efforts to improve the processes. These efforts are projects towards some objective. The objective is often discovered through Business Intelligence (BI) efforts. Each project is constructed into coordinated tasks.
The quality of process designs and project plans vary by skill level of the human designers, the whole of the various categories of incentives to do a great job (priorities, monetary or career incentives, or just a great work ethic), and resource constraints (time, money, personnel, equipment).
Projects can require various levels of creativity. For example, in progressively difficult order:
- A recipe. This is pretty much a push-button process. If the ice cream machine is acting up, call the vendor rep. These are processes we trained for, or at least the experts we engage have diligently trained for.
- A well-known tactic. These are use cases. They resemble our situation, worked well for others. But there is still customization required.
- Novel. These require experts to analyze the problem and devise a novel solution to a novel problem.
For all levels, more and more skills that are very specific and fairly static will eventually (meaning anywhere from today to no more than a few decades) be automatable as AI and robotics improve. That is, barring events we all can readily imagine, which I don’t want to get into. This is like the Pareto 90% that takes up 10% of the world’s collective human intellectual horsepower.
The first one, recipe, is currently at least partially automatable, at least from the side of the people instigating the project. The engaged experts might still be humans, such as lawyers, doctors, plumbers, and “gun-slinger” chefs and software developers.
The second are the solutions recognized by those with extensive experience. The battle-worn sergeant major.
The last one, novel solutions to novel problems, will be the last one standing. There are no published use cases. What is required is a plan that carefully progresses through a series of checkpoints of accomplishments and awareness of potential risks. In terms of sheer number of projects, these are like the Pareto 10% that take up 90% of the world’s collective human intellectual horsepower.
As AI and robotics spin the world faster and faster (something I look on disapprovingly as you would expect from an old Boomer such as I), new kinds of enterprises will pop up. Some will have been predicted by the AI prognosticators and some no one could claim to have seen coming. Either way, the novelty will present unforeseen kinds of complications. The new and existing enterprises will face a growing proportion of novel problems.
I strongly encourage you to read one of my favorite books, The Ingenuity Gap, Thomas Homer Dixon.
That Pareto 10% of novel problems that consume 90% of the world’s collective intellectual horsepower I mentioned will shift to like consuming all of it and way more that we don’t have. The AI of that time will fill the gap.
CEP and Process Mining for Undiscovered Processes
The swarms of AI Agents and IoT devices are billions or even trillions of senses about life on Earth. The AI agents will perform countless different tasks and the IoT devices sense countless different events (“edge-computed” in countless ways as well). That beats the heck out of the numerous sensors taped onto and stuck into me during an ER visit last year—12 EKG electrodes, the pulse oximeter on my finger, the blood-pressure cuff on my arm, the oxygen cannula in my nose, the telemetry pack on my belt, the IV line in my hand, the CT scanner circling my head, and the heart monitor tracing every beat.
Within those billions of AI Agents and IoT devices are countless undiscovered processes. Many won’t really be of apparent value, but the discovery of these undiscovered processes is the first step to better understanding of the world. A good portion of these processes are probably not purposely produced by people. Rather, they are emergent processes from known processes interacting with each other.
Complex Event Processing (CEP) and Process Mining are the tools used towards the discovery of undiscovered processes, the monitoring of processes, and adaptation of processes. This is the subject of my book, Time Molecules – The Business Intelligence Side of Process Mining and Systems Thinking.
The undiscovered processes are the context in which we will craft our plans. Useful plans aren’t made in a vacuum. They are made within an environment. They will interact with that environment. At least some aspects of that environment will probably fight your plan, in which case you can attempt to outflank those aspects, negotiate with them.
The events that are found (through CEP and process mining) to be the elements of processes are the base ingredients for strategy maps.
Strategy Map
Planning is really about navigating a system. It’s beyond a checklist of tasks. Every real system—whether a business, a project, or a human life—is a web of competing goals, useful metrics, configurations we can tweak, and risks that lurk around the edges. My strategy map is simply a way to make that web visible.
The nodes on the map are of a few types:
- Primary goals (what we ultimately care about)
- Objective goals (the steps we pursue to advance a primary goal)
- Metrics and KPIs (how we measure if reality is getting better or worse)
- Configurations (the knobs we can actually turn)
Risks belong there too. We often forget that avoiding risk is itself a goal—“not dying” is the most universal primary goal in biology—so risks sit on the map like everything else.
Configuration Trade-Off Graph: Exploring feasible changes over time The CTG represents actions as events, each one altering configurations that in turn shift KPI states. It is the search space of planning—where multiple goals compete, risks emerge, and trade-offs become visible.
Relationships Are the Whole Point
What makes the strategy map more than a pretty diagram are the relationships. Each edge isn’t just “A influences B.” It has:
- Direction. Which is the intended/hypothesized cause and the intended/observed effect.
- Strength (like a Pearson or Spearman score between KPI status values).
- Verb-like Label that hints at the mechanism (“more patients → more income”).
A relationship with strength 0.80 tells us two things:
- The effect is mostly real.
- But 0.20 of the story is missing—noise, unknowns, side-channels, friction.
Configurations sit inside the KPI formulas like genes inside a genome. A set of configuration values forms the “genotype” of the system; the KPI statuses are the phenotype. Change the genes and the organism behaves differently.
Tugging Strings, Changing a Tire, Pickup Sticks
Working with a strategy map is like tugging on a string in a tangled ball of yarn. Adjusting one piece inevitably shifts others. Sometimes we’re OK with pushing a KPI into minor pain if that gives us the leverage to improve a more important one. It’s like changing a tire. You can’t replace the tire until you jack up the car, the jack is a temporary strain on the frame so the real fix can happen.
Or think of the children’s game pickup sticks. To get to one stick, you often need to nudge others first. You accept a little disturbance so you can pull off the move you actually want.
That’s what planning really is—the art of controlled disturbance.
For my software developer audience, this notion is very familiar. If we’re not careful and knowledgeable of the system, we fix one bug and create two more. As we gain familiarity with the system and we maintain our careful diligence, the ratio of fixed bug to side-effect bugs will move closer to 1:1.
The Search for Feasible Configurations
The first step is always the same. That is to find some lever, dial, knob that we can tweak for a desired effect. But it is generally more than one tweak—it’s a combination of tweaks that leads to a desired effect.
Are there any combination of configurations that gets all KPI statuses within our pain thresholds?
Sometimes the answer is yes, and we’re done. Sometimes the answer is no, and that’s where our sapient intellect steps into some clever planning. We’re in a sort of Rubik’s Cube territory where we can see the final solved state, but we won’t get there in one move.
We need a sequence—sometimes two steps, sometimes twenty—where intermediate states may look ugly but remain survivable. We may have to accept temporary pain in one KPI to unlock a long-term improvement in another. Each move shifts the whole cube, and we must see several moves ahead.
LLMs as Tactical Assistants, Not Strategic Replacements
If a configuration looks promising but we don’t yet know how to achieve it, that becomes an objective. An LLM can help with that local question—“What can we do to increase patient volume?”—but it doesn’t know the global structure. It can propose tactics; the strategy map decides how those tactics fit into the planning of the larger set of goals.
Risks are not Limitations
We can at times have a tendency to treat risks as noise that gets in the way of moving forward. We downplay them, perhaps ignore them, and I’m sure it’s happened at least once in history that they have been even hidden from view. They’re probabilities of unwanted costs. A strategy map might have far more risks than goals, but that’s normal—life itself is risk-heavy. A plan is about achieving objectives while avoiding a minefield of risks. What matters isn’t avoiding risk but understanding each and the magnitude of the consequence. Which relationships could break? Which edges are fragile? Which assumptions can drift?
The strategy map treats a risk as just another goal (an anti-goal), another KPI whose pain level we want to keep below “broken.”
The Heart of It
The core idea behind the strategy map is to map out how pulling one string shifts the whole system. If we tug carefully and iteratively and build temporary supports (like holding up a sofa while the carpet is smoothed out) when a clean direct pull isn’t possible, we can achieve our goals in a stepwise process.
That is planning. It’s what humans are uniquely good at. And that is the capability AGI must eventually replicate—not by copying our brain’s wiring, but by copying this functional skill:
changing a system by temporarily stressing it but never breaking it.
Goals
I look at goals from a pessimistic standpoint. That is, I think of them as alleviating a pain. I could say a goal is to fulfill a desire, but somehow reframing it as “filling a void” resonates with me more. I believe that comes from our animal heritage where alleviating a pain is much more the norm in the “real” world (as opposed to so-called “First World problems”). For example:
- Hunger. This is more of a reactive prodding to keep you going towards alleviating your hunger.
- Yearning to reproduce. This could be thought of as a kind of hunger, but it’s special as it’s the apex hunger. The entire game is about passing the genes you have being passed on. The genes of any creature made a pact to form a system (the creature) to better compete.
- Fear. This is more a proactive prodding to prevent falling into a worse state. It drives us to gain status in the pack/pride/herd/community, accumulating resources (including persisting to fortify the ample resources currently under our control), and most importantly, to keep us going despite being plagued by other pains (such as wounds sustained in a battle).
- Growth. Evolution is based on relentless and seemingly unreasonable growth at the species and individual level. Relentless pressure to grow by all species creates the friction that drives change (evolution). I hate to say that even our economy is based on relentless growth which promotes competition.
Therefore, I’ve chosen to measure goals statuses in a performance management system in terms of levels of pain—OK, minor pain, pain, major pain, broken. That is as opposed to a progression of bad, OK, good.
In the context of this blog, “pain” isn’t the literal pain we humans feel when we suffer a major injury. Rather, it’s the state of how effective something is towards being able to accomplish its purpose.
Flavors
Flavors and colors aren’t just simple things. Flavors are simultaneous experiences of smells and tastes. Even colors are combinations of populations of red, blue, and green cones of the retina.
When I was working on my Prolog variant, SCL, I spent a lot of time thinking about how goals actually manifest in the mind. Simple desires are easy to understand in isolation — hunger, thirst, warmth, comfort. They’re like single levers: push the lever, reduce the discomfort, return to baseline. A rat press-lever → food → satisfied. One signal, one reflex.
But human goals rarely fire solo. Multiple instincts and pains run at once, layered in different intensities, and the interaction between them is where real motivation comes from. Hunger, ambition, fear, curiosity, social belonging — each pulls in its own direction, and what we call “desire” or “intent” is just the shape that emerges when they reach temporary equilibrium. We aren’t driven by one lever, but by a pattern of levers pressed together.
That was the mental model behind the strategy map: not a single reward loop, but a composition of competing goal signals, each one pushing or pulling behavior until the system finds a configuration that relieves the most pain without amplifying another. It isn’t one urge — it’s the geometry of urges.
Objectives
Objectives are a kind of goal. The difference between goals and objectives is that objectives are are employed towards achieving a goal. For example, we might work at a job we don’t like in order earn money to feed our family. The converse doesn’t work—we don’t feed our family to work at a job. The actual objective is to earn some amount of money and the job is just the means to an end. To meet the objective, we need to accomplish tasks in and out of work.
Goals and objectives are not a taxonomy (a tree) but a web of dependencies. There are sub-objectives beyond meeting expectations at work. For example, maintaining transportation to work, remaining healthy, and avoiding conflicts of interest with the company.
Maintaining transportation applies to objectives beyond commuting to work. Maintaining transportation is mutually beneficial. It enables us to work at our job and our job enables us to afford it to take our family on nice weekend day trips.
Remaining healthy is interestingly not strictly an objective to keeping your job. Indeed, it is a top-level goal itself—arguably the most important goal since other things will not matter if you’re not healthy.
Objectives are often team-based or domain-based, delegated. They can be isolated like a function, where it’s up to the team or domain to figure out how to achieve the objective.
Risks
Avoiding risks are goals. We just don’t think of them that way because they are also inconveniences towards achieving what we hope to gain. In terms of pros and cons, risks are like cons, but cons are generally an expected effect, whereas a risk is still probabilistic.
There are many more risks than what we normally think of as goals. There are competitive forces, which means they are after the same goals. Zero-sum is a mode, not a law. There are also many risks we’re not aware of because we didn’t want to waste energy and time driving ourselves crazy thinking of all the things that could go wrong (“analysis paralysis”). There are also unknown risks, the unintended consequences that we never would have thought of.
A risk can be a thing of its own such as obesity is a risk factor for a condition called diabetes. In the medical field it’s relatively easy to catalog risks since the field is mostly about rectifying bad conditions. Medicine is about juggling a set of risks to fix a problem.
However, there has been a shift of focus towards preventive care. In that case, a map of correlations between characteristics of patients, interventions (prescriptions, lifestyle changes) and their associated diseases is very beneficial. We can think of a risk as a low to mid probability correlation—versus a high probability correlation or even one proven to be a cause.
A risk doesn’t always stand on its own. Sometimes a risk appears because one action quietly cancels the effect of another. If one medication is prescribed to lower blood pressure while another, unrelated medication raises it, the second drug isn’t a “bad actor”—it’s a counter-force that reduces the net impact of the first. In other cases, a risk emerges because a dependency fails: an intervention works only if some relationship continues to hold, and there’s always a chance it won’t. Both types matter. One is a direct counter-effect; the other is the probability that an assumption breaks. Cataloging risks means noting not only the things that can go wrong, but also the ways different influences collide or drift out of alignment.
Confidence
Confidence could be thought of as a risk—the risk that an assumption is false. For example, if I build it, will they come? Let’s say I’m building a Spam Musubi kiosk. If my confidence is low, I can scrap the effort to build it, create an objective to improve the probability of them coming if I build it, (marketing, ensuring I’m filling a need for them), or proactively create a need for what I’m building.
Iterations
Plans are iterative, and that’s a good thing. It’s not just because we got thrown down on the cement sidewalk, not the soft mats of the dojo, and are forced to reassess things in real time. As we execute, conditions change because they are always changing anyway, our environment reacts to our actions, and we pick up new information. New information are things we didn’t know, things flushed out of the brush. With that new information, we might see flaws and/or better ways to do things. It’s also a reality check where we may find the plan is no longer necessary or worth pursuing. That is the fundamental value of agile project management methodologies.
But more important, things usually need to happen in steps. Take beef bourguignon as an example. You can’t just throw everything in a pot and hope for the best. You have to brown the beef to build flavor, sauté the aromatics separately, deglaze the fond with wine, simmer slowly to transform collagen into gelatin, cook the mushrooms on their own so they don’t collapse, and thicken the sauce only at the end. Each phase is distinct, each prepares the conditions for the next, and skipping or reordering them ruins the dish.
And this is where people often get confused by modern notions of efficiency. We intuitively think in terms of parallelism—take a big task, divide it into parts, and distribute the work. It sounds attractive because it’s easy to grasp and because many of our everyday conveniences reinforce that mindset. But parallelism only works when tasks are truly divisible and when their dependencies are well understood and tightly coordinated.
Most real plans aren’t like that. They aren’t frozen dinners you can simply throw into a microwave. They’re closer to beef bourguignon, a sequence of skillful steps where each stage changes the state of the system in a way that makes the next stage possible. Some company created an automated process to whip out frozen dinners by the millions so consumers don’t need to worry about elaborate plans. Products of all sorts are marketed to us so effectively that our need for sophisticated planning is reduced. But do we use that saved time for efforts that still require planning? For many no. They watch more TikTok. Even AI such as ChatGPT where the expectation is that we ask it for something and it gives us an answer. I’ve learned people hate “it depends” as an answer.
In an environment of world of convenience (much of the “First World”), we gravitate toward products and processes that are simplified, uniform, and easily parallelized—because those can be scaled. But genuine strategy, especially in complex environments, still depends on ordering, timing, preparation, and intermediate states that cannot be skipped or executed side by side.
Let’s explore planning as a component of AGI but also as a reminder of why we evolved our sentience and sapience.
Planning Process
Let’s dissect what I mean by “plan”.
Plans have a purpose. Accomplishing that purpose without screwing up anything else equates to a good plan. Plans consist of sub-plans, each a chain of cause and effect. A cause is an event that represents a change to a system. An effect is another event that represents the new state of the system after the cause. And that effect becomes another cause.
KPI Pain Phases
Planning starts with something very simple: every KPI has a status, and I measure that status in levels of pain. I mentioned before that the sequence I use for KPI status is:
- OK: (0.00) Everything is functioning fine.
- Minor pain (>0.0 to 0.30): A warning that attention will be needed soon. The probability for failure is very low.
- Pain (>0.30 to 0.60): We should address the pain, however, it still works.
- Major Pain (>0.60 to <1.00): Debilitating pain. Continuing operation is very dangerous and maybe not even possible.
- Broken (1.00): The system is dead. It’s beyond repair.
Focusing on the KPI status—as opposed to value and goal—is that the status is a normalized value.
It sounds pessimistic, but it’s accurate. A KPI only matters because crossing some threshold hurts the system. That pain becomes the force that pushes the plan forward.
A strategy map is my way of capturing how these pains interact. Each primary goal, metric, configuration, and objective sits in the map with a direction and a relationship label.
“More patients → more income (0.70).”
That 0.70 isn’t magic; it just means 30% of the story is something else.
To move any KPI out of pain, we adjust the configurations—which I think of as the “genes” of the system. Each config contributes to one or more KPI status formulas, and the whole collection of configs defines the organism’s behavior.
The first step in planning is trying different combinations of configurations to see if any set moves every KPI within acceptable pain thresholds. Sometimes there is a clean solution. Sometimes the search comes back empty.
An empty search doesn’t mean the plan is bad. It means the system is like a Rubik’s cube: we know exactly what the solved state looks like, but we’re not going to get there in one twist. We have to line up intermediate states—some KPIs dipping into minor pain temporarily — to set up the move that actually fixes the real problem.
That’s why planning is incremental. We tug on one thread, watch the others shift, and look a few steps ahead. The goal isn’t “perfect with one move”; it’s “don’t paint yourself into a corner.”
This is the point where LLMs are genuinely useful.
Ask: “What can we do to increase patients?”
You get a list of interventions—marketing levers, operational changes, staffing options. Each one becomes its own objective plan, with its own KPIs to track progress. The strategy map becomes the context that keeps those ideas honest.
Risk, in this framework, isn’t a constraint. It’s another primary goal—“don’t die.” Every relationship has its own probability, and planning is about shaping the system into a state where the combined probabilities produce an acceptable path.
Planning is manipulating the system’s genes to reduce pain without setting off an even bigger one. It’s iterative, multi-step, and rarely neat. And like a Rubik’s cube or a jack lifting a car so you can swap a tire, you often have to lift the whole structure before you can fix the one part that’s broken.
KPI Status Function
The KPI Status Function is the code that calculates a KPI’s status value. It can be as simple as a percentage of a KPI value versus its target. For example, if sales are $800 and the target at this point is $1000, then KPI status is 0.80 (fairly good). It can be more complicated such as assigning calculating a slope we wish to bring down to zero. I can be very complicated such as predicting the current chance for success given many variables (ex. chance for safely reaching Mars at any point in the journey).
Now that I’ve described correlations and inflections earlier and the KPI status function, I’d like to clarify the difference. The correlations are meant to reason about the relationship between two KPIs—or, how a change in state of one KPI (or configuration) affects the state of another. KPI status functions assess the state of a metric.
KPI Snapshots
A KPI Snapshot is a reading of all KPI values (especially Status). Each KPI value is recorded to the BI database as individual events, along with a set of attributes currently in play. For example, if a KPI is “Page Response Time”, a relevant attribute is the “tier level” of the cloud database service.
“Pain” as a Motivational Signal (The Itch That Drives Action)
Most planning frameworks sort outcomes into good, okay, and bad — but that feels artificial. In real organisms, motivation rarely comes from “goodness”; it comes from discomfort. Hunger pushes us to eat. Thirst pushes us to drink. Curiosity pushes us to explore. Desire itself is an itch to be scratched. It’s not blissful — it’s restless. The drive to acquire, to grow, to improve is not pleasure seeking, but tension relief.
To test ChatGPT’s “understanding” of the pain levels as described in my blog, Levels of Pain – Refining the “Bad” side of the KPI Status, I asked it to describe it in its own words. Table 1 shows its somewhat satisfactory response.
| Status | Meaning | Planning Interpretation |
|---|---|---|
| ⬛ Broken | Non-functional. The system cannot operate. Planning halts until this is resolved. Revenue collapsing, page loads timing out, customer satisfaction tanking — the system cannot operate normally. | Emergency state. No plan matters until stability is restored. Like a limb bleeding out — stop the bleeding first. |
| 🟥Major Pain | Actively damaging. Continuing risks cascading failure. Immediate attention required. The KPI is not broken yet, but trending toward failure. Customers are leaving, infrastructure is strained, costs are spiraling. A painful condition that cannot be sustained. | Must be addressed soon. Acceptable only as a temporary sacrifice if it enables relief elsewhere — and only with a clear path back to health. |
| 🟧 Pain | Severe stress. May be tolerated briefly but dominates decision-making. Noticeable degradation, discomfort, drag on performance. We’re operating, but every day hurts a little. Examples: slightly high bounce rate, support backlog growing, acquisition spend too high but manageable. | This is where trade-offs are negotiated. We may willingly accept this level to improve another KPI — if we believe the plan leads to recovery. |
| 🟨 Minor Pain | Very tolerable friction — yellow flags rather than red. A metric is below ideal but not harmful. For example slightly slower page load time, lower CTR this week, but nothing is destabilizing. | Safe to push on. This category is usually where we borrow capacity — meaning we let a metric dip slightly while we repair something more critical. |
| 🟩 OK / Healthy | KPI is performing within target range. The system is healthy, expectation is being met. No intervention required. | Can be leveraged. Healthy KPIs can temporarily carry load so we can focus attention elsewhere. |
Every KPI in a planning system behaves the same way. A metric isn’t “good,” it’s simply not painful enough to demand attention. Something only becomes strategic when failing to address it hurts enough to take priority over the other itches competing for relief. This framing is more honest than good/neutral/bad scoring — everything is a pressure signal, and planning is the act of deciding which itch to scratch next without tearing skin in the process.
Neuroscientists like Karl Friston describe a similar principle in biology: living systems act to minimize free energy, a formal model of surprise, uncertainty, and discomfort.
By free energy, Friston does not mean thermodynamics in the physics-textbook sense. He’s using the term as a mathematical proxy (there’s that word again) for something very ordinary: the gap between what a system expects and what it experiences. When that gap grows, the system is “surprised”, uncertain, or unstable. Reducing free energy simply means reducing that mismatch—by changing the world, changing behavior, or updating expectations. In plain terms, it’s the drive to stay within familiar, survivable bounds rather than drifting into chaos or collapse.
You don’t need the math to feel the parallel. Life behaves less like a pursuit of good outcomes and more like a constant reduction of irritation. We scratch the itch not because it brings joy, but because not scratching makes it worse.
That’s why Dōh operates through pain thresholds rather than reward scales. We aren’t optimizing bliss — we’re navigating trade-offs through the geometry of irritations, always choosing the next move that reduces pressure without causing rupture elsewhere. Planning is not about chasing good. It is the continual art of scratching the right itch at the right time.
Correlations and Inflections
The relationships between KPIs aren’t deterministic—they emerge from observed behavior in the system. A KPI might rise when another rises, fall when another improves, or remain steady until a threshold is crossed.
For this blog, the correlations are between KPI status values. The relationships are different based on attributes of the system. For example, the relationship between page load time for web site depends on the quality of the cloud service tier. See The Effect Correlation Score for KPIs.
The shape of these correlations tells us how sensitive the system is to change, how predictable it is, and where the risks hide. Below are four common forms, each with different planning consequences (see Figure 2 for a general idea of the line shapes):
- Pearson Correlation (Linear) This is the simplest and most familiar form, and so it is the default. As one KPI increases, another tends to increase or decrease in a proportional and consistent way. If revenue rises whenever website traffic rises, or failure rates increase as temperature increases, that’s Pearson at work. It assumes smooth, linear behavior, and is easy to visualize and reason about. The benefit is predictability—small adjustments tend to produce small, fairly proportional results. The risk is oversimplification; it won’t warn you about tipping points, phase shifts, or sudden instability.
- Spearman Correlation (Monotonic) Spearman is similar to Pearson but less strict. It only cares about whether two values move together in order (up/up or up/down), not whether they move in a straight line. It’s useful when the relationship is consistently directional but not proportional. For example, customer satisfaction might increase with response time, but gains taper off once response time reaches “fast enough.” Spearman captures the trend even when the exact magnitude varies. The advantage is robustness against noise and non-linearity; the trade-off is reduced precision about how strong individual changes actually are.
- Non-Linear Relationships (Thresholds & Hockey-Sticks) Some KPIs behave quietly for a long time, then suddenly respond explosively once a limit is crossed—a “hockey stick” curve. Page-load time might be fine up to 500 requests per second, then deteriorate rapidly. Healthcare staffing might absorb small delays with no effect, then collapse into backlog when a threshold is exceeded. These relationships are powerful because they reveal instability, fragility, or emerging risk. The danger is that planning based on average behavior misses the cliff. This is where contingency planning, buffers, and early-warning KPIs become critical.
- Multi-Phase Relationships (Piecewise Behavior) Many systems don’t have one correlation—they have several modes depending on context, season, or system state. A marketing spend increase may boost sales at first, then yield diminishing returns, and eventually trigger churn if customers feel bombarded. Each phase has its own dynamics, pain thresholds, and viable strategies. Multi-phase behavior is the closest to human psychology and real markets: relationships evolve. Planning must be iterative, and the Strategy Map should encode what phase we believe we are in—and what evidence could signal that we’ve entered another.

Pearson (1) and Spearman (2) correlations reduce a relationship to a single score (between -1.0 and 1.0), indicating how strongly two KPI status values tend to move together.
In a way, the correlation score can play a role akin to inhibitory synapses of the brain. It can narrow the search space, mostly with an inverse correlation (when A goes up, B goes down), by stating: “You don’t want to look at this path because it will only make things worse.”
Threshold (3, the hockey stick for example) and multi-phase relationships (4) are different in kind. They are not summarized by a number, but by structure. Where behavior changes, how sharply it responds, and which regime the system currently occupies. These shapes matter because they reveal instability, fragility, and phase transitions—exactly the conditions where planning fails if averages are trusted.
The Game of Dōh
Dōh is my attempt to address planning as a strategic game in the way Deep Blue and AlphaGo conquered Chess and Go, respectively. In Dōh, the gameboard is a strategy map.
Chess lives inside a closed world — fixed pieces, fixed rules, fixed objectives. Planning in life is more complex than chess, but it still does have structure discussed earlier (goals, metrics, objectives, configs).
Like most games, Chess, Go, and Dōh have a begin state and an end state that meets the criteria for victory for a contestant. Unlike most games or sports, the criteria for victory can take many more shapes than simply crossing a finish line first or accumulating more points. Games consist of iterations of your turn, my turn transactions. Each turn is governed by rules.
At least in my opinion, the most important skill is to see as many turns into the future as possible. That could be the essence of our super power. We can move the board around in the privacy of our heads before making a physically irreversible move.
A Dōh “move” is more than a single action. It’s a set of configuration changes applied to one iteration, followed by a recalculation of KPI pain levels. If a plan reduces one pain but pushes another beyond its threshold, that move is invalid—just like an illegal board position. If the move is tolerable, the game proceeds, searching for a sequence that reduces the target pain without breaking anything else.
The rules are simple enough to state—adjust configs, recompute pain, evaluate — but the combinatorics explode quickly, just like Go. The system doesn’t require domain knowledge to run—there is much that can be done with only the KPI status functions and the relationship structure. Semantics can be layered later through a Knowledge Graph or LLM advisory step. Dōh is not AGI, but it represents the kind of generalized planning substrate AGI would need: a standardized way to search through paths of change, one iteration at a time, until a viable future emerges.
The name, Dōh, has three meanings:
- (Dō) the Way in Japanese as in Judo,
- D’oh! what Homer Simpson says when he made a mistake. He should regroup and try again.
- Rhymes with Go.
A Simple Example of a Dōh Planning Game
We will go through a very simple example. But this is only an introduction. My intent for now is to illustrate at a high level the process of finding a solution to a complex system. In forthcoming blogs, we’ll dive into the deeper aspects. So please forgive the handwaving for the moment.
Board Setup (Initial State)
Figure 3 is an enhanced strategy map of a simple e-commerce scenario. There are three categories of nodes, five levels of pain, and four kinds of relationships—all shown in the legend at the right.
Before continuing, keep in mind that although the nodes have labels, in the context of the game of Dōh, they are really just abstract concepts. In upcoming blogs, we’ll discuss the “Dōh boards” are just graphs expressing the relationships between parts of a system, and how we compare similarities between “Dōh boards” as a simply a pattern, the basis for making analogies.
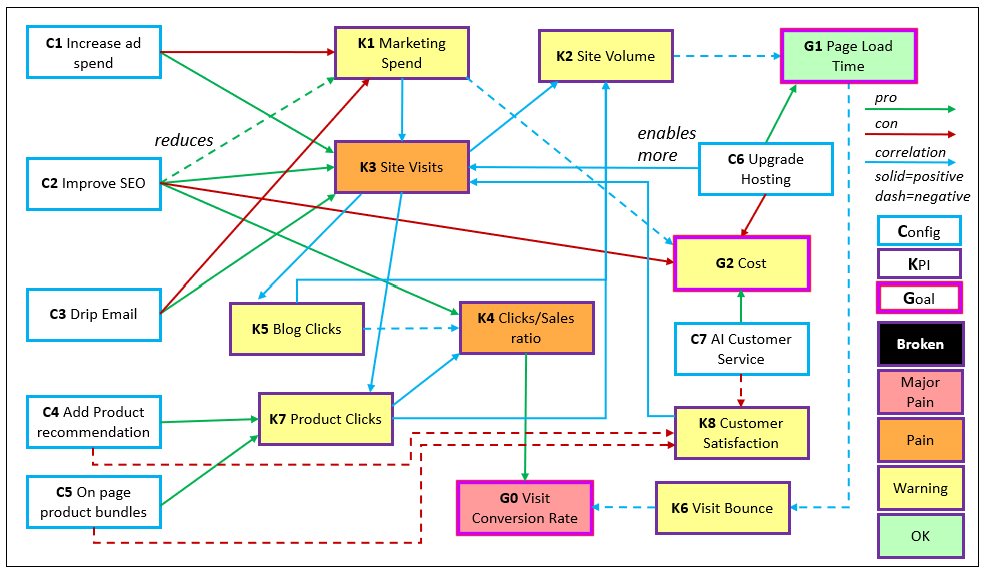
For all relationships (lines between the squares) in Figure 3, it’s interpreted as:

Table 2 shows a summary of the “pain” levels of the KPIs.
| Goal / KPI | Status Interpretation |
|---|---|
| G0 Visit Conversion Rate → 🟥 Major Pain | The core objective is failing; traffic and engagement are not producing outcomes. |
| K6 Visit Bounce → 🟥 Major Pain | Visitors are leaving quickly, undermining all downstream goals. |
| K4 Clicks / Sales Ratio → 🟧 Pain | Engagement exists but does not reliably convert into sales. |
| K3 Site Visits → 🟧 Pain | Awareness is present but insufficient to support conversion targets. |
| K5 Site Volume → 🟨 Minor Pain | Traffic is present but thin; growth is possible but constrained. |
| K1 Marketing Spend → 🟨 Minor Pain | Spend increases are tolerable short-term but amplify cost pressure. |
| K2 Cost → 🟨 Minor Pain | Infrastructure and operating costs are rising but still manageable. |
| G1 Page Load Time → 🟩 OK / Strong (Fragile) | Performance is acceptable now but risks slipping under higher load. |
The major problem currently facing this ecommerce business is the visit conversion rate (G0) is very low—it’s in major pain. This graph is simple enough to quickly see that this is probably caused by low site visits (K3), which eventually leads to painful clicks/sales ratio (K4. it takes lots of site clicks for a sale).
From the graph, we can see that there are a number of tactics we can employ to improve the situation. However, there will be side-effects of our efforts to increase site traffic. In particular, the page load time (G1) is a sacred metric. Without a sub-second load time for the visitors, nothing else matters. They 90% will move onto another site after waiting a couple of seconds.
Even though configurations appear as boxes on Figure 3—they may not be “just a setting”. A config may represent a full initiative or multi-week sprint: migrating hosting, implementing recommendation logic, carrying out SEO restructuring, or deploying AI support. In practice, a configuration is often closer to a project than a toggle. Turning one on almost always introduces side-effects, new costs, and an internal sequence of actions. The Strategy Map reduces each of these to a square so we can reason cleanly about relationships — but behind each square is a real-world effort with dependencies, risks, and measurable outcomes.
Configurations
This is the “energy” that instigates the change into the system. Table 3 shows descriptions of the configurations shown in Figure 3.
| ID | Description |
|---|---|
| C1 – Increase Ad Spend | Increases paid reach, leading to more site visits at the expense of higher marketing cost. Useful for rapid exposure but can become inefficient without supporting conversion improvements. |
| C2 – Improve SEO | Enhances organic visibility and long-term inbound traffic. Typically requires ongoing content refinement, link-building, technical optimization, and may reduce reliance on paid acquisition. |
| C3 – Drip Email | Nurturing outbound touch strategy — scheduled, multi-step campaigns aimed at re-engaging visitors or converting leads over time rather than in one hit. |
| C4 – Add Product Recommendation | Introduces recommendation systems (rule-based or AI-driven) to increase discoverability and product clicks per session. Often improves cross-sell uplift. |
| C5 – On-Page Product Bundles | Curated product sets packaged as single purchase options. Intended to raise average order value and conversion efficiency while simplifying decision effort for customers. |
| C6 – Upgrade Hosting | Improves infrastructure capacity — reduces page load time, supports higher traffic volume, and strengthens UX stability during spikes. Increases operational cost. |
| C7 – AI Customer Service | AI-augmented support that can scale quickly. Reduces response times and support workload but may risk dissatisfaction if issues require nuance or empathy. |
Table 4 shows some metadata about the configuration settings.
| Config | Min Value | Max Value | Current Value | Test Value (Proposed) | Unit / Interpretation |
|---|---|---|---|---|---|
| C1 – Increase Ad Spend | $0 / month | $250,000 / month | $40,000 | $55,000 | Dollars (spend per month) |
| C2 – Improve SEO | 0% (no SEO effort) | 100% (fully matured SEO program) | 35% | 50% | % of SEO maturity / coverage |
| C3 – Drip Email | Off (0%) | Full automation + segmentation | 10% | 30% | % implemented of email automation capability |
| C4 – Product Recommendation Engine | 0% (disabled) | 100% integration | 0% | 60% | % enabled + trained relevance quality |
| C5 – On-page Product Bundles | 0 bundles | 12 bundles | 3 bundles active | 6 bundles | Count of curated bundles |
| C6 – Upgrade Hosting / Infrastructure | Tier 1 | Tier 4 | Tier 1 | Tier 3 | Hosting tier / performance level |
| C7 – AI Customer Service | 0% (no AI) | 100% AI first-tier handling | 20% | 45% | % of support volume handled by AI |
The columns of Table 4 are read as follows:
- Min & Max Value define the “legal” move boundaries. A configuration can’t exceed them without breaking reality (budget, tech, physics).
- Current Value is the board state as of this turn. This matters for pain distribution across KPIs.
- Test Value is the move under evaluation. We simulate this value, recalc KPI statuses, and evaluate legality under pain rules.
- Unit explains how the configuration exists in the real world: some binary, some continuous, some capacity-tier based.
At the time of writing, AI isn’t anywhere close to being able to create a project plan, although it might do an adequate job of managing a project. That is, it can manage a project from a technical point of view, but perhaps not from a people point of view. By people point of view, I mean imagine a project manager without the insight of an empathetic person.
At the risk of sounding misanthropic, remember that even humans can effectively emulate feelings they aren’t actually feeling. So, an AI could be “trained” to appear empathetic. It will be extremely difficult to prove to me that an AI isn’t a giant step farther than the worst sociopath imaginable—although I believe a genuinely empathetic AI is possible.
At this point, the idea is to flesh out the sequence of steps and what each involves.
KPI Pain Levels
With just 3 goals, 8 KPIs, and 5 levels of pains, this high-level sample strategy map requires 55 rules. In the context of an enterprise, that’s not a tremendous feat, but there could be hundreds of KPIs. So, the authoring of those tasks would benefit from some sort of automation.
I asked ChatGPT to describe what the levels of pain should be for the three goals. Table 5 displays ChatGPT’s efforts.
| Status Level | G1 – Page Load Time | G2 – Cost | G3 – Visit Conversion Rate |
|---|---|---|---|
| ⬛Broken | Pages routinely exceed abandonment threshold (3–5+ seconds). Traffic collapses, SEO tanks, customers bounce instantly. Site reliability becomes existential. | Burn rate exceeds sustainability. We’re losing money faster than revenue can compensate. Each day alive shortens runway. | Conversion conversions near zero — traffic arrives but nobody buys. Business purpose has collapsed. |
| 🟥Major Pain | Performance frequently degrades beyond tolerance during peak load. Visitors still arrive, but frustration accumulates and retention suffers. | Spend is outpacing revenue meaningfully. Cash reserves or profitability are threatened, even if temporarily survivable. | Conversion is low enough that marketing is wasting money. Visitors show intent but fail to commit — meaning product/UX friction is high. |
| 🟧 Pain | Slight sluggishness. Occasional slow loads, acceptable but dangerous if left unattended. Only noticeable to sensitive users or during spikes. | Spending is higher than ideal but still safe. Investments may be justified, but improvement should be monitored and eventually corrected. | Conversions dip, but still useful. Good enough for learning, experimentation, and iteration — not good enough to scale yet. |
| 🟨 Minor Pain | Performance mostly healthy with small fluctuations. Not perfect, but comfortably within user tolerance. | Operating cost is mildly inefficient — could be tuned, but no real threat. | Conversion is decent but could improve. Good signal, not optimized signal. |
| 🟩 OK / Strong | Fast, responsive, sub-second average. Friction-free experience. Supports SEO, retention, and scaling. | Costs are aligned with revenue, predictable, healthy. Supports experimentation and growth runway. | Buyers convert reliably. Product, offer, UX and intent are aligned. A basis for scaling. |
Based on the descriptions of pain levels shown in Table 5 above, I asked ChatGPT to take a swing at defining the pain level rules for each KPI. Table 6 includes K1 through K4 and Table 7 includes K5 through K8.
| Status Level | K1 Marketing Spend | K2 Site Volume | K3 Site Visits | K4 Clicks / Sales Ratio |
|---|---|---|---|---|
| ⬛Broken | Spend is unusable or catastrophic (budget frozen, blown, or misallocated); no meaningful control remains. | Volume is frozen or wildly unstable; system cannot operate coherently. | Traffic is near-zero or unmeasurable due to severe failure. | Conversion relationship is effectively nonexistent (checkout broken, tracking dead). |
| 🟥 Major Pain | Spend forces extreme trade-offs elsewhere or growth stalls completely due to underinvestment. | Volume actively damages the system (overload, chaos) or drains momentum. | Visits collapse or fluctuate enough to destabilize planning and revenue. | Funnel is badly broken; sales fail despite traffic. |
| 🟧 Pain | Spend is clearly out of balance—too high for returns or too low to support goals. | Volume is clearly misaligned, creating cost, quality, or performance stress. | Visits are materially down or volatile, threatening outcomes. | Significant waste: clicks increasingly fail to turn into sales. |
| 🟨 Minor Pain | Spend efficiency drifts; results still justify it but require attention. | Volume is slightly off target—soft or pushing limits without immediate damage. | Visits show softness or inconsistency; trend is concerning but manageable. | Conversion efficiency slips; intent weakens but remains viable. |
| 🟢 OK / Strong | Spend is controlled and productive without stressing other goals. | Volume is healthy and sustainable, supporting growth cleanly. | Visits are stable and sufficient relative to expectations. | Traffic converts well; clicks represent genuine buying intent. |
| Status Level | K5 Blog Clicks | K6 Visit Bounce | K7 Product Clicks | K8 Customer Satisfaction |
|---|---|---|---|---|
| ⬛ Broken | Blog channel is effectively dead or compromised (visibility or tracking failure). | Bounce metric is meaningless due to outages or systemic errors. | Product pages or navigation fail; clicks drop to near-zero. | Reputational or operational failure makes customers unwilling to engage. |
| 🟥 Major Pain | Blog fails to attract attention at scale; strategy confidence erodes. | Bounce becomes extreme, signaling major UX, intent, or performance failure. | Product interest collapses despite traffic. | Trust erodes; churn, complaints, and refunds dominate. |
| 🟧 Pain | Blog underperforms enough to question ROI and strategic value. | Bounce undermines conversions and learning. | Users fail to move from browsing to product exploration. | Dissatisfaction rises; negative sentiment becomes visible. |
| 🟨 Minor Pain | Engagement is uneven; some content works while other posts lag. | Bounce creeps upward; engagement weakens but is not alarming yet. | Product interest softens; users hesitate to click deeper. | Minor complaints increase but remain manageable. |
| 🟢 OK / Strong | Blogs reliably attract attention and support discovery. | Bounce is within expected range for traffic mix. | Users regularly transition from content to products. | Customers are generally happy; trust and sentiment are stable. |
ChatGPT did return the rules in text form. That’s convenient for us to review these rules and iterate with our know-it-all partner to refine the rules. When we’re confident the rules are correct, we can translate the final set of rules into Prolog or other rule syntax.
See the file, kpi_pain_site_clicks.pl for an example of what the rules might look like.
Alternatively, a data-driven method for studying the how and why of KPI status phase changes (ex. what defines “pain”, “major pain”, “broken”) involves the use of support vector machines (SVM). I discuss this in my blog, Outside of the Box AI Reasoning with SVMs.
In regard to values for the rules, we’ll also need to create a Prolog of facts about symbols referenced in all the rules Prolog. Please see doh_facts.pl on the GitHub repository. Additionally, looking back at Figure 1, we see that Items 8 and 9 of represent a methodology to retrieve facts about each goal and KPI.
- Item 8 – Enterprise Ontologies and Taxonomies: Goals and KPIs are linked to ontology nodes, giving them semantic identity beyond a name or number. Through these links, the planning system can retrieve properties, classifications, and relationships stored in the knowledge graph, allowing rules to reason over what a KPI represents, not just its value.
- Item 9 – Accelerated BI Model: Most numeric facts used in planning—KPI values, status, trends, thresholds, and supporting metrics—are retrieved from the accelerated BI model. This model is optimized to return computed results from massive volumes of raw data very quickly, providing the quantitative facts needed by rules without pre-materializing them.
There we go! We’ve set up the board and now we’re ready to begin the game of Dōh.
The First Wash
The first iteration is to define our desired state and just see what we get. Chances are very likely we might fix the current problem but create another or even more. It’s rare to fix a problem with a complex system in a single shot. Recall my mentioning, fix one problem create two more? This is the same game.
However, you might argue that a very skilled practitioner will rarely fix one bug and create two new ones. That’s an illusion. For a novel solution to a novel problem, a super genius might seem to come up with a solution with no unintended side-effects. But that’s because the super-genius performed trial and error in the privacy of their head.
In many circumstances, the super-genius will still need to iteratively stumble towards a solution, but hopefully those occasions are fewer and the stumbles less intense, as opposed to when he was a newbie. So the game of “fix one problem, create two, fix those two … until we create no new problems and/or reach a compromise” is played by newbie, human super-genius, and AI alike.
I call this the first wash.
The new problems we create are the dreaded unintended side-effects. This is different from known risks we’ve already recognized and incorporated as goals.
Defining the Desired State
Figure 5 shows the first iteration of a game of Doh:
- The beginning state of the system, as it is back in Figure 3.
- The desired state of the system.
- The main idea is to take G0 out of major pain 🟥 to a minor pain 🟨 state, which we can reasonably handle for now.
- At the same time, we need to ensure that G1 remains in the OK state 🟢. Potential customers will likely never revisit a site if their first encounter is fraught with page delays.
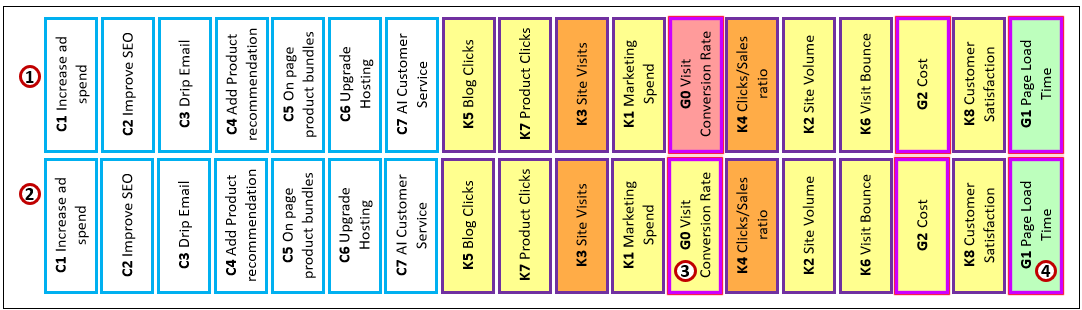
Additionally, the setup includes:
- The desired state (2) includes many implicit settings. The KPIs and goals other than G0 (3) and G1 (4) implicitly have pain thresholds of pain🟧. That means, the solution that brings G0 down to minor pain while maintaining G1 at OK can include the others moving to no higher than pain🟧level. That is, trading in a major pain🟥for potentially a few pains of lower intensity. Solutions are often bags of trade-offs and/or compromises. For example, trading in a life-threatening cancer for treatments that can be uncomfortable in many other ways. It doesn’t mean that’s the best we can do. But relieve from a serious problem, without creating other serious problems, is the first step.
- Each configuration has a set Min Value, Max Value, Current Value, and Test Value as shown back in Table 4.
- The rules for determining pain level could be encoded as Prolog, as described in Table 5, Table 6, and Table 7.
- Relationship values (Pearson, Spearman, Non-linear, and Multi-phase) are set based on actual data from the Performance Management system.
- KPI status functions should have different calculations for different qualities of the system. So, a tuple of system qualities will be defined for the configurations. For example, C6 Upgrade Hosting, consists of values Tier1, Tier2, Tier3, Tier4. Let’s say the current value is Tier1 but we’re trying Tier 4. The KPI snapshot values for only the times that Tier4 should be used to calculate the KPI status relationships.
Yes, that’s more setup than knowing for chess—where to place 16 pieces, how they’re allowed to move, when one can castle, and the definition of checkmate. But it does abstract the complexity of the real world to a point where we can effectively begin a journey towards a solution. That’s the idea of a game. It’s play. It’s a simplification of real life with guardrails and no more than nominal consequences for being wrong.
Making the Move
In chess, we make our move and our opponent responds. For Dōh, our “opponent” is an algorithm—basically, a genetic algorithm:
- Tries various values for each configuration.
- Those test values are plugged into the pain level rules for each KPI and Goal.
- The pain levels for the KPIs and Goals are compared against the pain thresholds. If none of the new pain levels exceeds the thresholds, we save the values and end.
- Otherwise, we save up to say 10 of the best results.
- After a number of tries, say 10,000, the algorithm ends.
Like a great chess player that is capable of tracing many possible paths, without overlooking even better possibilities, the genetic algorithm follows a number of evolutionary paths.
Figure 6 shows the results of the “first wash”:
- This is the initial state. The same initial state shown in Figure 5.
- This is the best result from the first wash.
- We met our desire to move G0 from major pain🟥to warning🟨. However …
- In doing so, K8 went from warning🟨to pain🟧 and …
- G1, the heart of the system, went from OK to pain🟧.

That’s certainly not an acceptable configuration. However, for complex systems, a solution is generally not a one-shot deal. The side-effect of G1 moving to an unacceptable value illuminates that we must figure out how to improve its ability.
Analyzing the Next Move
If you look at the row for C6 in Table 4, we see that the hosting level is Tier 1. So we need to set the hosting Tier to a higher level. It’s currently set at Tier2. The algorithm is allowed to try any of the Tiers. But when it did try a scenario with a higher Tier, the cost (G2) suffered greatly—reaching major pain or even “breaking”. That’s because the cost for a higher Tier exceeded the target value of G2.
So we need to change the target value of cost (G2). Figure 7 illustrates a detailed look at a subgraph of G2 and C6. The left-most node is a configuration (C8) that I added, which was not shown in Figure 1. It’s the configuration for setting the target value of cost (G2). The addition of C8 makes it explicit that adjusting the target value for costs is an acceptable configuration setting.
Here is a description of the items with the Hosting set at a high Tier4. 1 through 3 represent the current values, and 4 through 6 represent the new values:
- The max value of C8 is currently set to $800K.
- The target value for G2 is the Max of C8. This is a soft-coded value. The values can also reference the Prolog facts mentioned earlier—doh_facts.pl on the GitHub repository.
- The pseudo-code formula for the KPI status of G2. With the current max target cost of $800K, the KPI status of G2 is in major pain🟥.
- The new max value of C8. A $1.5 million dollars should do.
- The new max value of C8 changes the KPI status value of G2 to 0.40—less “pain”🟧than the older max target value of $800K. What’s a little pain for a cost budget anyway? Everyone always needs more money.
- The precious page load time (G1) cannot ever be in pain. But the old max target value prevented us from upgrading the host tier, resulting in poor performance with higher site volume.
- With the new max target value for cost (G2), we could upgrade the hosting, which accommodates the higher site volume, which results in a happy page load time.
- But higher target cost might mean funds are taken from somewhere else. Ouch.
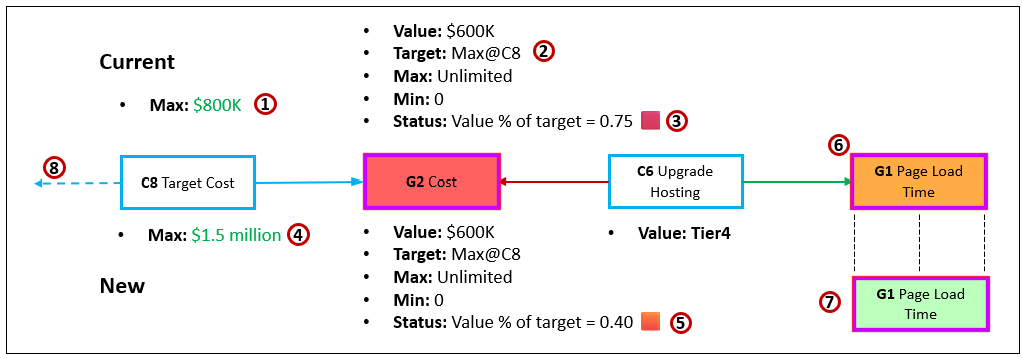
Item 8 of Figure 7 is an important point. Often, such things are swept under the rug.
Kobayashi Maru and Beyond
As Captain Kirk did at Starfleet Academy when he couldn’t find a solution under the rules, he changed the rules. Yes, that is possible. If a system is thoughtfully designed, the architects built in mechanisms for adjustment. But it’s wise to see if we can just tweak a few knobs, flip a few switches, or just shake the box a little before we go in and open the box and mess with the parts.
A good architect also implemented a back door into the engine room. In this case, we can tweak the rules. However, that does take the game up a few notches of complexity, similar to 3D or 4D chess vs. 2D chess.
This is a Good Stopping Point
At this point, I’ve presented the main idea of the game of Dōh. We’ll stop at this point because it’s time for you and the grandkids to get to bed otherwise Santa won’t come. We’ll continue after the Holiday Season. In the next year, we’ll dive deeper into the aspects of:
- Smarter genetic algorithms.
- Solutioning parallelism.
- Abstraction through Graph similarity.
- Pain rules changing after iterations.
- Relationships changing after iterations.
However, if you did read through this entire blog and some of the associated blogs, you must be highly motivated … hahaha. So I imagine you probably just needed to be pointed to the trailhead and can take it from there. I wish you a spectacular journey.
Conclusion
The training of the intelligence of each of us humans doesn’t begin at birth with our brain working out the confusion of all that we’re sensing, all that we’re feeling, natural instincts, and feedback from our organs. It doesn’t even begin when some critical number of neurons are formed in our brain before we’re born. It really begins hundreds of millions of years ago with a cell that sensed light and/or other chemicals.
In some metaphorical sense, each of us goes through an extremely accelerated version of that evolution, starting as a single cell merged from two, then growing from cell by cell from there. We even look like an embryonic fish at some point. But once we’re born, we’re not just dropped off into the jungle. We’re born into a rich culture. Not just we humans. Our hominid ancestors and primate cousins do. They pick up cheat sheets from our culture. It may seem like taking a decade or two to go from baby to mastering a valuable skill is a long time, but it sure beats the millions of years it took for that technology to build, each insight almost by random chance.
LLMs are an amalgamation of our culture that was built up over tens of thousands of years, beginning with things like starting a fire and sculpting tools from rocks. Culture is a massive component of our sapient intelligence. It side-stepped inspirations that took millennia to stumble upon. Today we can learn in a few years what Einstein discovered, compared to how long it took before Einstein came along to add his link to the chain.
With whatever faults LLMs have at this time and its ultimate relevance at the time of AGI, nothing has ever captured and digested our broad, hugely-dimensional human culture like it has. Being multimodal, it even blends the best of symbolic and syntactic knowledge. It may hallucinate, it may not solve the hard problems, but that’s due to the “black hole” formed of complexity and ubiquity of imperfect information that faces intelligences (at least within our universe).
Even humans learn our culture (which includes our technology) but often don’t really understand the full scope of relevance. It affects our decisions and the activities we do individually and as a society. Because of culture, we don’t need to independently reinvent fire or learn tips and tricks it took humanity and really smart people millennia to stumble upon.
For an effort to be called AGI, I don’t think it’s a requirement for it to be built unsupervised upon completely blank chips and code. Evolution began as a completely unsupervised process, taking an awfully long time through brute-force combinatorics to come up with a self-replicating molecule (DNA). Skip ahead a billion years give or take, to the time of eukaryotes and multi-celled creatures, and the evolution space is narrowed by the combination of the features of the geology of Earth and the relentless arms race of wit between predator and prey.
Evolution isn’t as purely a brute-force of a process as atoms randomly forming molecules in a soup before a self-replicating one came about. But evolution is still in the realm of massive trial and error. Instead, we can provide an AGI candidate with the massive knowledge of our collective cultures (as we do for LLMs) culture, world models (Yann LeCun’s JEPA) representing common sense, and the primitives for planning to organize (the game of Dōh).
Evolution of life is an arms race of creative solutions. Evolution’s great advantage (over creative planning and design) is that it has the luxury of a long time to do so because there are no humans dictating deadlines—we humans are goal-driven towards solutions whereas evolution is opportunistic, filling in whatever void happens to come its way. Indeed, our human intelligence is a product of Earth’s evolutionary process—the interaction of a variety of cyclical processes—that took about 4.5 billion years for it to accomplish. It also has the luxury of impeccable feedback (there is no better model of the physical world than the physical world itself).
Our self-awareness—the awareness of ourselves as entities apart from the “whole”—means we are a “species of one”, no longer playing a game of survival at the species level. That self-awareness pressures us to find solutions within the time scale less than the length of our lives. Our shortcut to novel creativity is analogy-inspired innovation, which enables such planning within a short period of time.

Here is a related YouTube video that popped up on my feed after I posted this blog (because “they” are listening): Procedural Generation in Games – Computerphile
From my favorite YouTuber, exurb1a, a recently posted video I wasn’t aware of until yesterday, Chess is When You Microdose Infinity. At 7:53 is a great, relevant line: “Great chess players aren’t computers, they are artists. And like great artists, they dance with infinity.“
If anything in this blog resonated, you’d like this video, Why Every Idea is a Remix. In this blog, I convey that the source of our ideas started with the bounty of solutions evolution created, which had all the time in the world and the resources of an entire planet; which we observed, reformed, and passed down through thousands of generations of our culture … that’s the main idea, anyway.