In this mind-bogglingly complex world in which we live—countless moving parts fraught with imperfect information of many types—a versatile highly-functioning intelligence requires quick access to a wide variety of information in order to make intelligent decisions. It’s not that all decisions should be made from that full breadth of information. It’s that all decisions are made in unique contexts that will require some subset drawn from a massive pool.
But every decision lives in its own unique context—and that context can pull in any subset from a long tail of possible inputs. You don’t need every data stream for every choice, but you do need the option to tap the right micro-signals when the moment demands it. Expanding our sensory palette—with more granular, edge-processed event streams—lets enterprises shift from shadowy outlines to vivid detail, making each decision on a view closer to reality.
Likewise, today’s enterprise data consists mostly of what we’ve had the time, budget, or imagination to capture—usually related to the most obviously important metrics. We capture a “pareto-esque” 10 percent of signals that are easiest to collect—your core KPIs, major application logs, high-level dashboards—and from that dim, fuzzy picture we make most decisions. Like the rods of our retina provide a shallow but complete value-based view in a dimly lit room, but the cones of our retina reveal more details when the room is adequately lit.
As what we’re able to sense widens, so does our capacity to robustly respond. If an enterprise were intelligent, it’s making decisions on a very fuzzy view of the world. With richer, more granular input streams, businesses can develop a truer awareness of their operations, customers, and environments — much like how a living being becomes more intelligent by sensing more of its world.
Upstream of Time Molecules
This blog is about the “why” of Time Molecules. That is, why did I write a book with the subtitle, “The Business Intelligence side of Process Mining and Systems Thinking”? That’s because a BI system based on processes and systems is a far richer bedrock to start from in a dynamic world that is composed of webs of interacting systems, as opposed to a bedrock of values.
That’s quite a mouthful. Please see my earlier blog, Sneak Peek at My New Book-Time Molecules, for more of an understanding where Time Molecules fits.
Figure 1 shows the data flow of the Time Molecules system. The left side is the focus of this blog (1), the why of value of Time Molecules. That is essentially what is known today as event streaming and/or complex event processing (2).

Figure 1 notes:
- The upstream event source of Time Molecules.
- IoT (Internet of Things) and AI agents represent a huge proliferation of event data sources.
- From traditional OLTP databases, we collect and integrate historic transactions into BI systems.
- Events and historic transactions can be stored en masse in data lakes.
- Process mining focuses on discovering the systems represented in data.
- Time Solution is the creation of process-centric business intelligence structures. This is the part of the event stream that the Time Molecules book is focused on.
- The process/system-centric structures are analyzed.
- The Azure DW icon looks like an email icon.
- I’ve written a blog, Embracing Change with of Wide Breadth of Generalized Events, that outlines how to implement a large number of abstracted events into a BI OLAP cube using Kyvos Insights.
The art and craft of business intelligence (BI) is still the solid foundation upon which we curate the information that enterprises use to make decisions. However, making consistently intelligent decisions in a complex environment requires a wide breadth of information. BI systems have traditionally provided an expanded breadth of information integrated from the perspectives of a few major enterprise applications (SCM, ERP, CRM, PoS, etc.). Today, with methodologies such as data vault and data mesh (see my blog, Embedding a Data Vault in a Data Mesh), the door is open to the magnitude of dozens of data sources.
However, as I mentioned, informed decisions require consideration from a pool of thousands of data sources. Note that I’m not arguing the ludicrous point that you must literally tap thousands of raw sources every time you decide. Rather, across the countless decisions and contexts an enterprise navigates, each choice draws on its own tailored mix of inputs, and in aggregate that adds up to thousands, not merely dozens, of data streams ensuring relevance.
The left side of Figure 1 above (the shaded part) depicts a couple of prime data sources for events. In particular, the Internet of Things (IoT) can represent millions of event sources, from billions of sensors deployed throughout the world, to tens of millions of cars and home appliances, to millions of implanted medical devices (like my new pacemaker), to millions of machines deployed across thousands of manufacturing plants, to answers to queries posed to millions of AI agents yet to come.
Before we move on, a few miscellaneous items:
- Time Molecules (and my previous book, Enterprise Intelligence) are available on Amazon and Technics Publications. If you purchase either book (Time Molecules, Enterprise Intelligence) from the Technic Publication site, use the coupon code TP25 for a 25% discount off most items.
- My goal for Time Molecules and Enterprise Intelligence isn’t to power a mega surveillance grid, but to share my own insights with fellow data engineers, data scientists, and knowledge workers. I want us to stay rooted in the real world—its events, its processes, its context—rather than lean blindly on whatever an AI tells us. In other words, somewhere between those elite AI researchers and those who learn enough about AI for it to better tell us what to do. At the end of the day, human judgment remains the bedrock of true intelligence. Remember, AI is currently, in many ways, just “smart enough to be dangerous”.
- The title of this blog, Thousands of Senses, is a nod to Jeff Hawkins’ brilliant book A Thousand Brains, which offered a new theory of intelligence grounded in how the brain models the world. I’ve recently mentioned his earlier work, On Intelligence, in my blog, Embedding Machine Learning Models into Knowledge Graphs.
This is Part 2 of a trilogy that dives deep into the intuition for my book, Time Molecules:
- From Data Through Wisdom: The Case for Process-Aware Intelligence
- Thousands of Senses
- Analogy and Curiosity-Driven Original Thinking
Five Senses?
When I was in grade school (ca. late 1960s through 1970s in the U.S.) I was taught there are five senses—sight, sound, touch, taste, and smell. It’s a neat, manageable, high-level list, easy to memorize and relate to in grade school. I little after my time in grade school, the teachers might toss in a few more such as proprioception, the sense of body position, the vestibular system (balance) or even interoception (internal signals like hunger or heartbeat.
But we don’t have five senses … or six, seven, or even fifty-ish. Depending on how low we drill, there are hundreds, thousands, or even millions—but millions is stretching it too far practical purposes.
Every one of the millions of rods and cone in the eye—each cone tuned to blue/green/red light frequencies and relative position in our sight—is its own sensory stream. Every nerve ending in the skin—some for pressure, some for vibration, others for temperature or pain—is a unique signal source.
Your tongue doesn’t just simply taste sweet, salty, sour, and bitter. It houses dozens of types of bitter receptors, each specialized to detect different toxins that are good in small doses, as detailed in Taste What You’re Missing, Barb Stuckey. There is the relatively recently recognized umami, the savory taste of glutamate detected by specialized receptors and boosted by ribonucleotides. And the tongue is hypersensitive to texture, acting as the fine-tuned gatekeeper before ingestion (which might shed light on Josh Weissman’s book, Texture Over Taste).
Your olfactory (smell) contains hundreds of receptors, each attuned to a specific molecular structure, many of which we can’t name but instantly recognize. Hearing is more than a single stream—it’s the result of mechanical vibrations decomposed into frequencies—a natural Fourier transform playing out in your cochlea.
Even our emotions could be thought of as senses—they sense the conditions that should trigger their respective emotion. But not just fear, love, hate, envy, etc. We can think of each learned fear of particular species, even down to particular instances—for example, we might fear dogs, but not cats, we could even fear just a specific mean dog down the street. Some are trained senses—like fear from your amygdala recognizing a pattern that once signaled danger. That too is a sort of sensing—pattern recognition over time, deeply tied to survival.
Beyond those human-scale senses lies an even subtler frontier—the gut microbiome, sometimes called our “second brain”. Deep in our digestive system, billions of microbes and nerve cells are in constant communication with the brain through the vagus nerve and chemical signals that affect mood, hunger, and even intuition. If we think of each of those signals as a kind of sense—tiny updates about our inner world—then we’re not talking thousands anymore but potentially millions more senses, depending on how you look at it. It’s a reminder that perception doesn’t stop at the edges of our nerves but extends through a living ecosystem within us, quietly shaping what we feel and how we think.
We’re generally not cognizant of hundreds or thousands of senses because our brain fortunately performs magical stages marshalling sets of senses into symbolic abstractions and generalizations. Our brain also prioritizes and filters what we sense so we focus on what’s important now and relegate the rest to noise in the current context of urgency. Using these streams of “symbols”, we’re able to associate onto a map/model of the world in our heads. For example, a few aromas, the music, conversations, dining at a restaurant.
Evolution has honed our senses over millions of years to spot what mattered most for our ancestors’ survival—but that legacy also imposes profound blind spots (to put it mildly). There is likely far more happening around us than we can ever detect. Much of that “noise” may have nothing to do with terrestrial life yet could be the lifeblood of other forms of cognition. For example, we didn’t know about radiation until our technology expanded to where it collided with it.
To overcome these limits, we’ve invented microscopes and telescopes that stretch our vision, spectrometers that reveal hidden chemicals, and sensors that convert inaudible signals into data we can interpret. Yet even these devices—and the motivations driving their development—reflect the biases scaffolded by our culture and technology. A truly robust intelligence must therefore account not only for more streams of data but for the uneven fidelity and perspective baked into every one of them
Massive Proliferation of World-Level Senses
As the two major phenomenon of IoT devices and AI agents become more embedded in our personal daily lives and the processes of enterprises, they’ll serve as new sensory organs—extending perception into areas we currently overlook:
- IoT devices—embedded sensors in everything from factory equipment to smart light bulbs to pacemakers. Remember too that connection to credit cards, social media, our phones, etc. make each of us humans IoT devices as well (that’s pretty awful). At the least, we’re the thing that’s being “measured” by an IoT device, like a thermometer in a corn field measures the air.
- AI agents—software “bots” autonomously crawling data sources, running diagnostics, issuing predictions, and executing actions—are multiplying our event sources by orders of magnitude. They will somehow organize (engineered organization or even some level of self-organization) into event-emitting systems.
Every smart thermostat adjustment, machine-health ping, autonomous inventory reorder, or model-inference call becomes its own event stream. The result is a sensory network that grows exponentially, providing enterprises with unprecedented visibility into operations, customer interactions, and environmental conditions.
The future of intelligence—in machines, in enterprises—won’t be about reasoning from limited, albeit the “most important” inputs. It will be about integrating thousands of granular streams, recognizing the patterns that emerge when you listen with all your senses.
From around 2019–2022, the prevailing assumption in AI was that simply increasing LLM parameter counts—GPT‑2’s 1.5 B in early 2019, the Scaling Laws paper in mid 2020, and GPT‑3’s 175 B in mid 2020—would drive ever‑greater intelligence. The thought was that at some point of scaling up those parameters, AGI and later ASI would emerge. That scaling delivered impressive leaps, but by late 2022 into 2023 it became clear we were hitting the s‑curve’s diminishing‑returns zone and that there is more to AGI and ASI than ever-higher parameter counts.
One of those missing pieces towards AGI/ASI, at least in the enterprise, is sensory richness—thousands of senses. Event streaming and complex event processing (CEP) aren’t new. They’ve powered real-time systems for over a decade and are profound technologies. But they were always eclipsed by hype cycles around big data, the cloud, machine learning, and now LLM-driven AI. Sensory richness isn’t about inventing new infrastructure; it’s about elevating these existing event technologies so we don’t just observe the enterprise, but truly feel it’s every pulse in real time.
This doesn’t mean LLMs are dead—businesses love to declare that about anything hyped so they can move on to the next big thing—but it does mean there’s more to AGI than just bigger models, for example, retrieval‑augmented generation (RAG), chain‑of‑thought prompting, agent frameworks, Mixture‑of‑Experts tricks.
CEP and event streaming are far more than another buzzword—they’re a foundational pillar for AI. I propose that authentic AI, like human intelligence, requires “thousands of senses,” not just the simplistic “five senses” analogy. Our brains process countless real-time data streams—sights, sounds, micro-sensations—much like CEP and event streaming handle continuous, high-velocity events. These technologies enable AI to ingest and act on live data, from fraud detection to personalized recommendations, powering real-time decision-making. As AI evolves to mimic human-like awareness, event streaming’s role as a sensory backbone will only grow, making it a quiet but indispensable force in the AI revolution.
More than Simply “More Data”
Before moving on, this blog isn’t simply about “more data”—which had its day during the data lake hype (ca. 2010s the LLM-driven hype around Nov. 2022), especially for those in analytics domains (business intelligence and machine learning). The “more data” aspect of this blog is about more sources, not so much about volume.
It’s not that BI and data science (let’s just call it the application of machine learning) hasn’t already presented at least a few “thousand senses”. BI and data science might integrate data from relatively few sources (integrated into a dimensional model for BI and a comprehensive set of cases for data science), but those integrated sources often involve hundreds of attributes across a dozen or two entities. Some of those entities such as customer, product, and even location can include hundreds of attributes—for example, how many things can be said about a person?
While a BI dimensional model breaks down the world into entities, their attributes, and a number of measures, the typical data science structure is a set of cases. A case is a symbol (label, name) for a grouping of characteristics. It can be people (ex. customers, students, employees, countries), events (ex. earthquakes, sales of cars, a census), and any other thing that is a grouping of sub-things. For example, for a list of US states—Idaho, Hawaii, California, Michigan—are each a case, each with a set of attributes such as population, dominant political party, land area, top product, etc.
Ontology versus Process
However, these are based on attributes (label of some thing or concept) and measures (metrics). The difference between looking from a concept versus event perspective is that a concept is a collection of attributes and events are defined more specifically as date, a label for the event, and some case id that relates it to a specific cycle of a process. The value of looking from an events-centric view is that we can abstract anything into a lowest-common denominator of those three parts. Additionally, events imply time, which means we have a common dimension upon which we can integrate any phenomenon.
Figure 2 illustrates the ontological view of the world versus the view of a process, both very simplified. An ontology is about encoding structure—what and how things and concepts relate to each other. A process is about cyclic phenomenon—it’s centered around time, the probabilities of what happens next.

Ontologies (and taxonomies) are the building blocks of a knowledge graph. It’s a structure of much interest today, in large part because of its symbiotic relationship with LLMs—LLMs are very helpful in helping subject matter experts author knowledge graphs and knowledge graphs provide a deterministic, human-approved map of knowledge.
However, whereas ontologies and taxonomies describe things (symbols) and how they are associated, from streams of events (observations), we can create graphs of how events correlate—what wires together, fires together. Those correlations form the end-product of what I describe in Time Molecules. That is, a web of hidden Markov models, as illustrated in Figure 3.
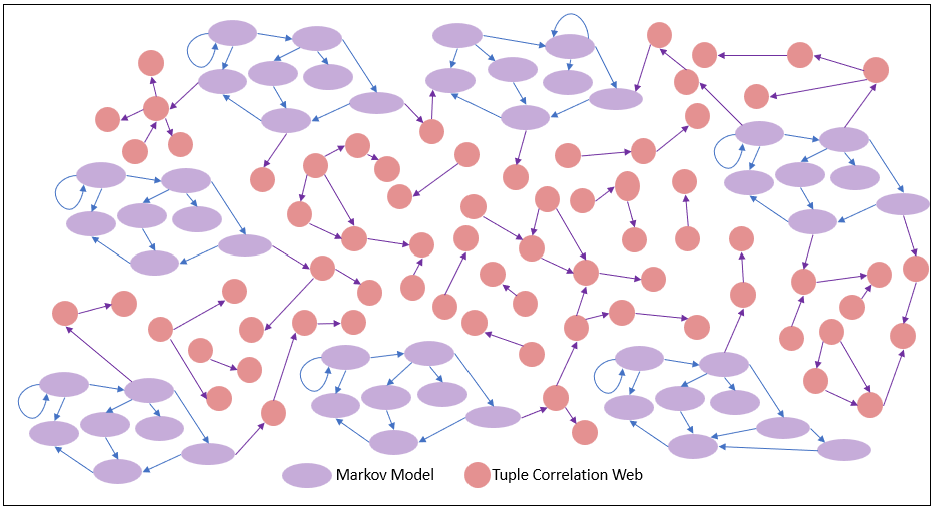
The linked hidden Markov models are composed of two sub-structures: Markov models and Bayesian/Conditional probabilities. This web of probabilities is a map that can shed light on clues of causation, used for strategy development and risk management. I’ve written about such structures that could augment ontology-centric knowledge graphs in, Beyond Ontologies: OODA Knowledge Graph Structures.
I’d like to now share some thoughts I have on why we should shift from thinking at the level of things to thinking at the level of processes.
Symbolic Thinking to Systems Thinking
We’re symbolic thinkers. That means our primary method for devising our plans and decisions are based on manipulating in our head a map of symbols through models of the world trained in us. Symbols are things we imagine. Usually, symbols map to something in the real word—a word, a thing, a person, a place. Symbols are correlations of groups of sensed signals that at the same time over and over again.
Over years of experience and training, models of how processes in our world works are built—encoded in a massive web of our brain cells. From the map/model things we perceive in the real world, we can imagine what will happen as the state of those things hypothetically change. Like a general or engineer moving about objects on a map or CAD drawing, respectively, we manipulate the symbols of the model of the world in the safety of our brains before committing to physically irreversible actions.
Step outside the brain, and you’ll see this same architecture at play in enterprises. It’s a sprawling network of streams of events:
- Customer behaviors, interactions, and support cases.
- Sensor data from manufacturing floors, delivery trucks, or smart shelves.
- Sales pipelines, supply chains, marketing impressions, and employee engagement signals.
- Network logs, security alerts, financial transactions, social sentiment, email metadata, IoT feeds.
Each of these is a stream of sense, and together they can form a high-dimensional representation of what the enterprise is experiencing. My book, Enterprise Intelligence, was originally titled, The Intelligence of a Business. The underlying concept of my book is my thought that a business is like an organism. Just as an organism survives through the coordination of many specialized senses, a business thrives by integrating diverse streams of input—far beyond what we’re traditionally cognizant of through the KPIs we’ve included in dashboards.
Yet most businesses, like schoolchildren with their five senses, only recognize a handful of these inputs at a time. They might track revenue and headcount, maybe NPS if they’re progressive. But like the body ignoring the subtlest itch or the warning scent of something off in the air, they miss what they can’t yet sense properly.
Even the large language models (LLM) of today are symbolic “thinkers” in that they are trained from humanity’s corpus of symbolically-based text. Yes, the sequences of symbols of our text are converted into something not non-symbolic vectors of a very highly-dimensional space. But at least at the time of writing, it’s rather constrained by the limitations of what we can express in text alone.
With systems thinking, rather than juggling isolated symbols, we train ourselves to see the world as a recursive hierarchy of components (components made up of components), each made up of relationships and feedback loops (positive or negative loops). Software developers can see the foundation of componentized systems thinking in:
- Domain-Driven Design — Because DDD explicitly models a system as a set of bounded contexts (components), each with its own language and rules, and then defines clear relationships and integration patterns between them—mirroring how systems thinking emphasizes hierarchical components and their interactions.
- Process Mining — Because it reverse-engineers real-world process flows from event logs, uncovering feedback loops, bottlenecks, and emergent behavior in a running system—exactly the kind of loop-and-structure focus at the heart of systems thinking.
- Functional Programming —Because FP treats programs as the composition of pure functions—self-contained components whose outputs depend only on inputs—supporting recursive structures and predictable feedback paths, and enabling you to trace system behavior top-down rather than chasing mutable state.
In practice, systems thinking means:
- Mapping interdependencies, not just entities—tracing how a supply-chain delay ripples into customer satisfaction and revenue.
- Identifying reinforcing and balancing loops, so you know which actions amplify a trend and which dampen it.
- Recognizing delays and accumulations, because stocks (inventory, cash, goodwill) don’t adjust instantly to flows (orders, payments, support tickets).
- Focusing on structure over events, since recurring patterns emerge from the network of feedback far more reliably than from one-off signals.
By adding this layer—seeing symbols not as static tokens but as nodes in a dynamic web—we elevate our enterprise “mind” from a map of data points to a living model (where the dots are connected) of cause and effect. That’s the leap from symbolic thinking to true systems thinking, and it’s the final piece in turning thousands of discrete senses into coherent, actionable intelligence.
It’s often said that a system’s “whole is greater than the sum of its parts”. That’s true when the system exhibits genuine emergent properties—usually a system of parts impeccably following simple rules. Emergent properties are difficult, sometimes nearly impossible, to explain through descriptions of the parts and their relationships. A great example of an emergent property is an ant colony’s foraging trails. No single ant “plans” the optimal path to food, but as each ant deposits and follows pheromone cues, a robust, efficient network of trails emerges—far smarter than any one ant’s behavior.
But in most practical cases, a system is a “reasonably repeatable” process or set of practices—a procedure that reliably produces some intended outcome. In other words, it’s less about mystical synergy and more about well-defined steps, feedback checks, error handling, and guardrails that guide execution toward success.
The reason I say “reasonably repeatable” is that the parts of a system intend to follow the rules, but the rest of the world often somehow gets in the way. So there is always only a probability that works as intended at any given instant.
Processes Across Time and Snapshots of an Instant
Everything is a process, but it changes slower than the process of our minds. That is, as fast as our brains can process what our senses can sense and our brains/body purposefully observes. Whatever we make of data and computed information, it’s based on events we’re able to sense.
Like that poor boiling frog, most things in the world change too slowly for us to think of what we see as a snapshot of a process as opposed to being a thing.
Why BI Focused on Entities, Not Systems/Processes
In the early days of business application software development (ca. 1970s-1990s, the “bad old days”), every byte of storage and CPU cycle was precious. Relational databases—emerging in the late ’70s (ex., Oracle 1979)—excelled at storing the current state of an entity (a customer record, an order, an invoice), so applications were built around this model. Recording every change as a first‑class event would have doubled or tripled storage needs, slowed writes, and required complex replay logic that the hardware of the time—mainframes and early client‑server servers with megabytes of RAM and limited I/O—simply couldn’t support.
Computing resources were constrained to a “big-iron” mainframe (and later small clusters of SMP servers) in a “computer room”—a locked, climate-controlled space housing a single mainframe or a rack of minicomputers. With storage measured in megabytes, limited RAM, and narrow I/O paths, an entity-centric approach dominated: update-in-place, overwrite the old value, and occasionally persist a few audit fields. True data centers, with rows of servers, SAN arrays, and high-speed networks, didn’t emerge until the 1990s. Only with the rise of data lakes and the cloud in the 2010s did high-throughput, event-first architectures like Time Molecules become feasible.
As a result, business applications had to design to mitigate database size:
- Mutable entities—one row of data per entity. For example, for customers there would be one row in a “customer table” for each customer (taking some shortcut liberties here). Updating a customer with new values means to update that row with the most recent value, overwriting old values—no additional storage was required.
- Transactional history was limited if any at all. Maybe the last six months of transactions, if lucky.
- There wasn’t the luxury if nice-to-have columns. Only columns (properties/attributes) actually used by the business could be added.
However, as hardware and software improved over the decades, and audit and analytics needs arose, techniques for storing extensive history were developed:
- UI & System Events: Mouse clicks, key presses, and error exceptions were handled in code but rarely persisted as business events.
- BI & OLAP (mid-1990s): Slowly-Changing Dimensions Type 2 (SCD) resulted in a new entity record versioned select attributes, foreshadowing early concepts of event sourcing by preserving historical states.
- Data Vault (2000s): Extended SCD Type 2 to track every attribute, building history tables in ETL batches but lacking real-time ingestion. This approach approximated event sourcing but remained constrained by batch processing and entity-centric storage.
- Early Event Sourcing (2000s): Emerging in niche domains like version control and financial systems, event sourcing stored every state change as an immutable event log, allowing state reconstruction via replay. However, it remained impractical for mainstream applications due to storage and compute limitations.
It wasn’t until the late 2000s, when storage costs sufficiently plummeted, streaming protocols began maturing, and robust data centers and cloud infrastructure offered massive I/O and compute, that event-first architectures became practical. Event sourcing gained traction as a formal pattern, enabling systems to store and replay event logs for auditing (ex. GDPR), debugging, and state reconstruction (time travel).
Platforms like Microsoft StreamInsight (2010) and Apache Kafka (2011) enabled high-throughput, replayable event logs, while frameworks like EventStore (2012) provided dedicated support for event-sourced systems. Yet, as mentioned before, the rise of the likes of “big data” (Hadoop, Spark), data science, and, more recently, LLM-powered AI often overshadowed event streaming and complex event processing (CEP)—except at enterprises where a use case is fundamental to the business, for example:
- Hedge funds (ultra-low-latency algorithmic trading)
- Fraud detection at banks (real-time anomaly scoring)
- Programmatic ad exchanges (millisecond bidding)
- Industrial IoT for predictive maintenance (on-the-fly anomaly detection)
- Network security monitoring (SIEM and threat detection)
Of course, Kafka is a big deal. My point is that my mom has heard of ChatGPT, but not Kafka.
LLMs Lack Immersive Context
Just as biological senses form the foundation of human intelligence, IoT devices, enterprise applications, and analyst queries create the sensory network for modern AI. Every sensor reading and user interaction is an event—a data point that a “thousand senses” AI must process. Without this fine-grained event fabric, even the most advanced LLMs lack the temporal context and process dynamics needed for true intelligence.
The intelligence in each of us is progressively and iteratively built from the process of our lives—fully immersed in the supremely complex rough and tumble world. Each of us is built from a unique sequence of events, which is immersed in everything else going on, even if we’re not cognizant of much of it. Every decision we make and everything we encounter is a snapshot from our unique path. There is no level of biographical book or extensive video (like if we were in “the Truman Show”) from which one can replay our lives with the same feelings and knowledge that lead to the same decisions.
My new book, Time Molecules, is about setting events as another cornerstone of BI, pushing AI-driven insight, leveraging event sourcing to capture and replay the full history of state changes to different points in time (the ability to “time travel” through a detailed log of events), enabling systems to not only paint a picture the present but also reconstruct the past to anticipate the future.
Recognition in an Adversarial World
Thinking of our world as adversarial doesn’t betray a neurotically pessimistic attitude of life. I’ve mentioned that the prime notion of one of my favorite books, Thought in a Hostile World, by Kim Sterelny, is that it’s plausible that the evolutionary force that drives higher intelligence in the creatures of Earth is indeed the eternal arms race between predator and prey, each with a new way to fool the other and then finding catching on to the trick.
Business is adversarial—competition between vendors of a product (and every business is a vendor selling something) and getting the most from a customer for the least (profit). The majority of business as usual is a zero-sum game of market share.
In an adversarial world, information is imperfect. A well-fed lion, tiger, or bear is skilled at obfuscating information, at least long enough to prevent you from fleeing before the situation is such that there is a high probability of catching you.
So it’s advantageous for an intelligence to be very robust about how it recognizes something. For example, we don’t recognize when we’re being scammed by checking of a list of boxes. A innovative scammer has figured how to scam with something that’s not in the check list. It’s just like spammers finding new ways to get past the spam filter until the spam filter is updated to recognize the new spam tactic.
Decision forests are a great example of a machine learning that recognizes this. Instead of one decision tree, there are many littler decision trees each with different set of input parameters and different paths and weights between nodes to recognize the same thing. The decision forest can be presented with thousands of features, but each decision tree considers just a few of them.
But by the time some nugget of information reaches our databases—for example, consider the fact that Eugene Asahara flew to Phoenix on March 2, 2025. That fact is stripped of all the richness of contexts and paths that lead to that trip. In fact, thousands of people flew into Phoenix that day, all for unique reasons under unique circumstances.
From Sensor Streams to Tuples
In the enterprise, countless kinds of sensory signals occur and could be collected as events—each easily abstracted into tuples of a timestamp (anything with a date is an event), a case identifier (ex. order number, session ID, device ID), an event type, and an open schema of associated properties:
- Clickstreams – Every mouse-click, scroll, page view, or button tap can be logged—showing who navigates where, in what sequence, and for how long. Together they paint a vivid map of user intent and friction points.
- Communication Threads & Message Classification – Every email, chat message, or support-ticket interaction can be captured as a sequence of messages—each tagged with a classification (ex. question, answer/response, acknowledgement, escalation, complaint/angry tone, praise, information request). By recording the thread ID, message timestamp, sender/recipient, and classification label, you trace not only what was said but how the tone and intent evolved over the conversation.
- IoT Telemetry – Sensors embedded in machinery, buildings, vehicles, or wearables emit streams of temperature readings, vibration alerts, geolocation updates, and more—turning every device into a little seismograph of operational health.
- ML Model Predictions – Behind the scenes, your recommendation engines, fraud detectors, and churn-prediction models fire off their scores and confidence levels as discrete events—each one a judgment call by an AI influencing the course of events.
- Process Steps – In a BPM or workflow engine, every state change—“order received,” “invoice approved,” “shipment dispatched”—is an event. These are the footsteps of your business as it marches through its day-to-day choreography.
- Financial Transactions – Each sale, purchase, refund, or tax payment is recorded as an atomic event, capturing amounts, timestamps, parties involved, and ledger impacts—your enterprise’s pulse of value exchange.
- Internal and External Interactions – Emails sent and received, support tickets opened, phone calls logged, regulatory filings submitted—these interactions with customers, vendors, and government agencies become events that trace the contours of your organizational relationships.
- Analytical Queries & Responses – Every BI dashboard refresh, SQL query execution, or LLM prompt-and-response pair is an event. They reveal not only what questions users asked, but also which answers mattered enough to spark decisions.
But like a single nerve impulse, any one event stream—even with a perfect history—tells you only so much on its own. Streams are continuous, high-velocity, and granular, and feeding them one by one into your analytics engine quickly becomes overwhelming. What you really need is breadth: a diverse collection of streams ingested in real time and held in a common backbone for correlation and pattern detection. That’s exactly the role of event streaming and complex event processing (CEP).
Event Hubs
Event hubs are the neural nexus (like the thalamus) of this architecture—a highly scalable, partitioned pub/sub layer that decouples producers from consumers and guarantees ordered delivery. Whether it’s Azure Event Hubs, AWS Kinesis, Google Cloud Pub/Sub, or Apache Kafka, each plays the same role:
- Ingest at Scale — Producers (IoT sensors, applications, ML models, user clients) publish events into topic partitions, allowing millions of events per second with configurable retention.
- Durable, Ordered Storage — Events land in time-ordered streams that persist for hours or days, giving downstream processors the full history they need to replay or backfill.
- Decoupled Consumption — Multiple consumers—real-time analytics engines, batch jobs, machine-learning scorers—can independently subscribe to the same stream without blocking each other.
- Low Latency & High Throughput — By buffering and partitioning at the broker level, event hubs deliver sub-second end-to-end latencies even under heavy load.
Once events arrive, they’re available in massive, ordered repositories—whether that’s a cloud data lake, a time-series database, or a globally distributed store like Cosmos DB—ready for CEP, aggregation, or feature extraction.
Balancing Imperfect Information with Information Overload
A key takeaway of this blog is the tension between two forms of imperfect information in enterprise intelligence. On one hand, limited event sources leave gaps in our view of what’s happening. On the other, chasing every possible signal leads to information overload—an explosion of data that overwhelms analytic resources. (In legal discovery, for example, drowning reviewers in thousands of document boxes is itself a tactic to obscure insight.)
Over eons, evolution has fine-tuned our senses to filter out the noise. That is, what is the sweet spot of our senses that let humans perform such high levels of cognitive gymnastics? Dogs pick up ultrasonic whistles and eagles resolve individual rodents from hundreds of feet—capabilities that would drown human cognition if wired into our day-to-day experience. Instead, we inherit just the sensory bands and granularity that our survival demands.
Likewise, modern edge-computing devices pre-aggregate raw streams into the events that matter. A pacemaker, for example, continuously samples every heartbeat but only reports discrete events—an arrhythmia detected, a pacing threshold adjusted—instead of streaming raw ECG waveforms. By shifting that coarse-to-fine processing to the edge, we distribute compute, conserve downstream resources (including network bandwidth), and ensure analytics pipelines see only the salient signals, not endless noise.
Events versus Readings
Our senses mostly detect changes in the state of things around us. These changes are picked up by our senses, we sense the change of state of rod and cone cells of our retina, receptors in our nose, tongue, and skin. But we can also observe (readings) of the state of concepts.
Readings are snapshots taken that are not triggered by some observed change. For example, a temperature device in a corn field could send a message only when the temperature changes by a certain threshold (a rule) or a reading at set intervals.
Figure 4 illustrates the difference between readings and events, and that tuples are snapshots of time:
- Represents a timeline, moving left to right.
- The colored lines represent a set of signals that come and go during the timeframe.
- Readings are taken at regular intervals. Notice these lines appear across the timeline at regular intervals.
- An example of a tuple. This records which lines appear at this point along the timeline. In this case, only the azure blue and green. In normal tuple nomenclature, it would be expressed as: (1, 0, 0, 0, 0, 0, 0, 0, 0, 1, 0)
- The reading of the azure blue and green lines with no other signals is read three times.
- Example of an event—occurrence of a change. In this case, the event is triggered by the reactivation of the purple signal. But the tuple includes all other lines that are active at the time purple reactivated.
- The next two events after 5. The pink line starts, then the green line ends.

Here are some of the key takeaways I intend for Figure 4:
- A tuple (4) is a snapshot of time—a description of some point in time. Tuples could be thought of as events. In the case of the tuple at 4, the event is, “azure blue and green are signaling, but the others are not”. It is like watching a video and stopping at a frame.
- The tuples we’ve captured are themselves its own stream of events.
- See how events are triggered by change (7), but readings are taken at set intervals (3)? Readings are taken when there isn’t a device that communicate a change (event) to us.
Stream Alignment and Tuple Formation
Each domain (ex. crop health, energy efficiency, customer support) may have a different number of abstraction layers. Some might jump from signals to tuples to events to processes in one hop. Others might require multiple layers of abstraction. But across all of them, there is a rough pattern:
- Granular signals stream in.
- Time slices form tuples.
- Tuples are clustered into events.
- Events are sequenced and modeled via Markov models.
- These models capture the flow of process and meaning.
Events arrive in individual streams—each with its own cadence, type, and format. These could be:
- A temperature sensor firing every second.
- A sales API logging transactions every few milliseconds.
- A delivery drone reporting altitude every 5 seconds.
These streams must be sliced and diced, for example, by farm section, device type, or business unit, and of course, time. Once aligned, we slice time—say every minute or ten seconds—and take a simultaneous snapshot of every stream in that group.
This time slice becomes a tuple of measures—a high-dimensional instant in the life of the system. It’s just like your brain forming a perceptual frame from all its rods, cones, olfactory sensors, touch receptors, and emotional signals at once.
In BI, a tuple is a computed snapshot consisting of qualifying properties and one or more computed values, usually a sum or count. For example:
- The sales of potatoes in Idaho for 2023 is a tuple— presented as (Product=potatoes, Location=Idaho, Year=2023, Sales=$10 M). That tuple is probably an aggregation (SUM, in this case) of thousands of sales transactions of potatoes in Idaho during 2023.
- From a stream of hourly data from a weather device in a potato field in Burley, ID, we could create the tuple, (City=Burley, State=Idaho, Month/Year=202306, Max Temp=94F, Min Temp=65F).
Just about all logs and ledgers of data—event streams, business transactions, observations—are computed into such “qualified values”, tuples. Tuples are the basis for the ubiquitous “slice and dice query pattern of traditional BI. It’s difficult to not think in tuples—every thing can be described as a set of class values. For example, here are tuples, two for two different tuple schemas:
- Move that couch in the southwest corner of my living room to the northwest side of my living room.
- (What=Couch, Where=Living Room, Owner=Me, Location=southwest)
- (What=Couch, Where=Living Room, Owner=Me, Location northwest)
- I caught five papio at Pearl Harbor last week Tuesday whipping with silicon strips. The next day, I caught three oio at Pearl Harbor dunking with shrimp.
- (Fish=papio, Location=Pearl Harbor, Date=06/10/2025, Style=Whipping, Bait=Squid)
- (Fish=oio, Location=Pearl Harbor, Date=06/11/2025, Style=Dunking, Bait=Shrimp)
Events are a kind of tuple—consisting of a datetime, case, and event name. For example, if I stopped at Winco, Home Depot, and McDonalds on my round of errands last week, we could create a set of these tuples. These three tuples comprise a case, the places I stopped at on my round of errands on June 1, 2025:
- (Date=06/01/2025 2:15pm, CaseID=Errands for 20250601, Event=Winco)
- (Date=06/01/2025 3:05pm, CaseID=Errands for 20250601, Event=Home Depot)
- (Date=06/01/2025 3:45pm, CaseID=Errands for 20250601, Event=McDonalds)
On another day, the case for that day might be:
- (Date=06/03/2025 2:10pm, CaseID=Errands for 20250603, Event=Winco)
- (Date=06/03/2025 2:40pm, CaseID=Errands for 20250603, Event=Safeway
- (Date=06/03/2025 3:40pm, CaseID=Errands for 20250603, Event=McDonalds)
From Data to Information to Data to Information to Data …
Although in my previous blog, From Data Through Wisdom, I describe data as an elemental fact and information as the output of some computation by some algorithm, data that is indeed elemental is actually quite rare—because anything we think of as a data point is still the result of something.
For example, on my recent vacation, I bought a lot of rocks at Escalante Rock Shop, paid for an Airbnb, and rented a car a few weeks ago. Those are each data points. From those data points, we can deduce that I was on vacation—which is information. But the information that I was on vacation can also be a data point that could be plugged into a function deducing why I didn’t answer work email at that time.
Note: A function takes in a set of parameters (features) as input, runs those parameters through a procedure (algorithm), and spits out a result—turning facts into insights. Strictly speaking, a function will always return the same result for the same set of parameters. Meaning, it’s fully independent of what is going on outside of it.
Further, each of those data points aren’t sterile facts. Something lead me to go on vacation, purchase rocks, rent a car instead of taking my own, renting an Airbnb instead of a hotel or camping (it was a great camping area).
So data is computed into information which is plugged in as data into another function which spits out another nugget of information, and on and on. The tracing of data to information to data to information is really what the ontologies that comprise knowledge graphs are. We recognize a tree because:
- Trees have leaves, branches, and roots.
- In turn, we recognize that a leaf is green, flat, there are very many of them, etc.
- Green can be many named shades such as olive, lime, Kelly, or emerald.
- Emerald green’s is RGB is #50C878.
- “G” is roughly 530 nm in wavelength.
What else can we say about the green-ness of the leaves? About light? What about the tree’s place on the taxonomy of life? The fruits, flowers, pests, soil type, bark, deciduous? Further, what can we then say about fruits, flowers, pests, etc.?
You get the point. Everything in the world that we can imagine is a result of an extremely messy nested web of things. But for practical purposes, we need to draw a box around such ontologies somewhere. Without such a box, analysis becomes impractically difficult. The point is that the “box” we draw around the ontology must be bigger than we’ve been accustomed to, even if not impractically unwieldy.
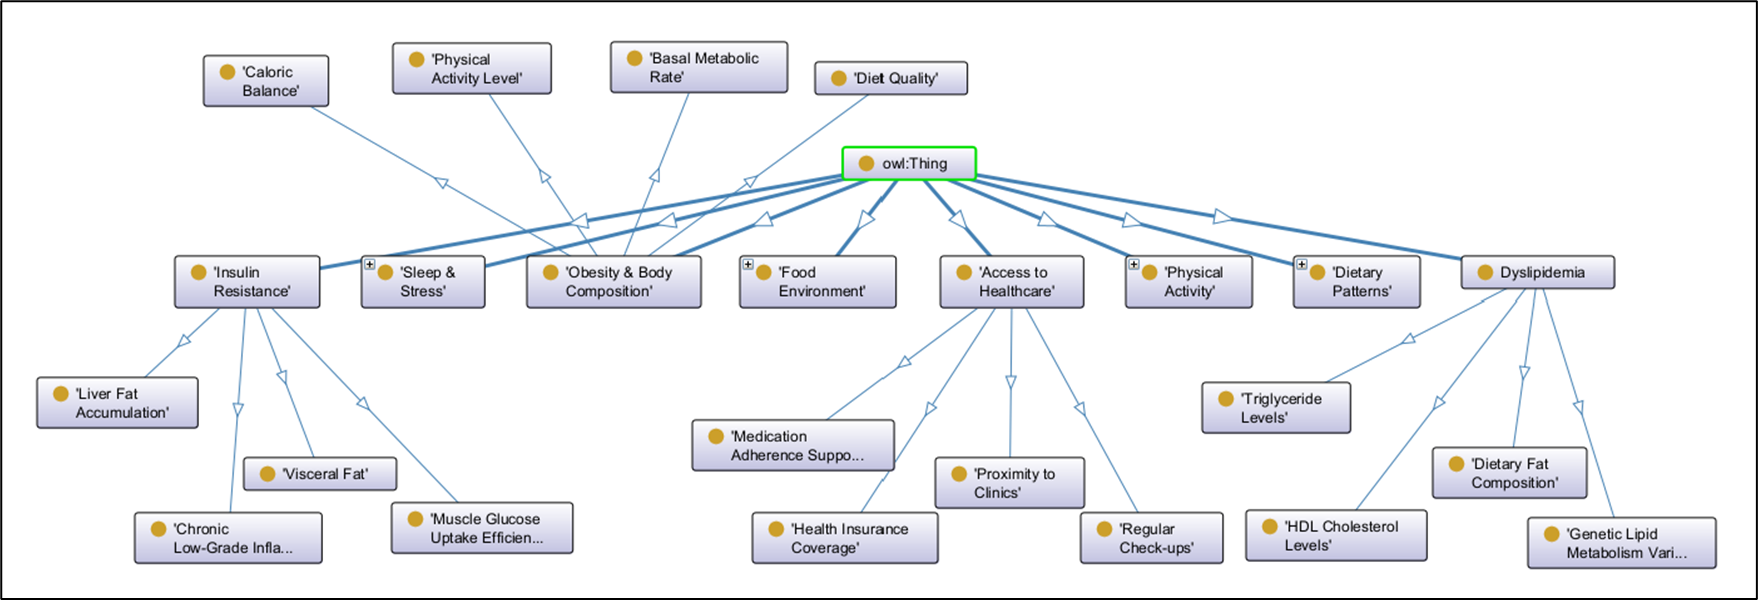
Figure 5 shows a hierarchy of factors that go into accessing risk for developing Type 2 Diabetes (green outline).
Note: Since I’m not a doctor, I asked ChatGPT (who isn’t a doctor either) to generate this sample ontology for me. So yell at OpenAI for any misconceptions about Type 2 Diabetes.
Focus on Metabolic and Physiological Factors (blue outline). It is one of the factors that can lead to Type 2 diabetes. But it is itself some value computed from another set of factors.

The nodes highlighted with magenta in Figure 5 are drilled down to another level of factors as shown in Figure 6.
As we peel the “onion(s) of reality” back layer by layer, the number of factors that contribute to anything we can think of multiplies—like Egyptian walking onions … hahaha—and the space of paths that lead up to the explanation of anything grows exponentially. There is no escaping that. Instead, what the human species has done is resign itself the process discovered by Thomas Bayes—that is the Bayesian method of:
- Taking a good initial guess based on what little data is available and within our ability to process.
- Adjusting our guess in real time as we iteratively learn more and receive updated information.
#1 are the initial probabilistic predictions trained by our experience—our “best guess”. But life is an iterative process, the loop of #2. To perform #2, access to a library of thousands of senses is required. Today, for better or worse, through IoT, event streaming technologies, AI agents, and BI architected for systems thinking (and process mining), that dream and/or nightmare is ready for prime time.
Final Thought
Anyone who has visited the giant sequoias of Sequoia National Park, hiked among the hoodoos of Bryce Canyon or the trails of Zion know you can’t capture it in a photograph. I’m sure that’s because a photo mostly stimulates the sense of sight, but not all that we feel throughout the rest of our brain and body, those thousands of other senses.
Further, what senses evolution provided to us is what was important for the survival of our ancestors over the past few hundred million years. We’ve invented ways to sense things beyond our body’s senses, but I’m sure there are very many more we haven’t even imagined looking for.
