The transactional unit of meaningful human to human communication is a story. It’s the incredibly versatile, somewhat scalable unit by which we teach each other meaningful experiences. Our brains recorded stories well before any hints of our ability to draw and write.
We sit around a table or campfire sharing stories, not mere facts. We gossip, we pass down family lore, and myths and legends of our culture. We compose tales, songs, poems, and even pictograms (like cave art, or memes of today). They are compacted, densely rich units of knowledge—stories, which are easier to pass down from generation to generation when writing still wasn’t a thing.
When we hear a story, the elements of stories link to like elements of other stories, in ways that are much richer than the fragmented nature of ontologies, encyclopedias entries, dictionaries, and lists of guidelines. Stories lay out contexts, challenges, progression, the interaction of various roles, and usually lead to some point, a moral, a lesson. We love a good story or joke with unexpected twists and endings because it’s new knowledge which our brains crave.
In this blog, I discuss how we can encode stories that can be integrated in an enterprise knowledge graph (EKG), analyzed across stories, and decoded for consumption. I also need to mention that by “human-level intelligence” in the title, I’m referring to strategy, creative intelligence that sets us apart from other critters that exhibit tactical intelligence at best.
This blog is really a sequel to my previous blog, Reptile Intelligence: An AI Summer for CEP. Reptilian intelligence is based on learning, but statistical learning—great for low-dimensional who, what, where questions returning answers of simple construction—just a simple answer. Whereas stories encode the how any why questions, which are much more highly dimensional, complicated, often complex.
A few notes before we move on:
- Code and large files related to this blog (Python, RDF/TTL, LLM prompts) can be found in the GitHub repository.
- This blog is Chapter VI.4 of my virtual book, The Assemblage of Artificial Intelligence.
- Time Molecules and Enterprise Intelligence are available on Amazon and Technics Publications. If you purchase either book (Time Molecules, Enterprise Intelligence) from the Technic Publication site, use the coupon code TP25 for a 25% discount off most items.
- I’m not an evolutionary biologist, an evolutionary psychologist, a neuroscientist. I know data structures and solving bleeding-edge business problems with them. But for at least three decades, I’ve studied and taken tremendous inspiration from those fields in order to look beyond the focus of the time. My apologies upfront for the liberties I’ve taken in order to convey concepts to a BI audience.
- Please read my intent regarding my work on AI.
Our Brain’s Subconscious Story Crunching
We sense and process torrents of signals from many sensory systems (with hundreds of distinct receptor types and thousands of channels) across our bodies. Primarily, we need to recognize something and react quickly with a hopefully appropriate, beneficial response. The vast majority of interactions require no more than that—navigating micro-situations in traffic, cooking or picking up meals, paying bills, and other chores.
Even when an event is more complicated—say, your boss asking for a TPS report tied with a big ribbon—you already know how to do it. What’s common about these events is there’s nothing new to learn; it’s recognize-and-react. You could ask about the strange ribbon request, but you’d rather get the boss off your back and move on.
Real-time Making Sense
What inspired the notion of stories as the unit of human intelligence happened around 2001 when I read The Man Who Mistook His Wife for a Hat (originally published in 1985). In it, Oliver Sacks describes cases where memory, perception, and reasoning falter—but the brain still insists on weaving events into a continuous story.
Oliver Sacks’ case The Lost Mariner shows the mind’s reflex to keep a story going even when memory fails: a patient with chronic amnesia (Korsakoff syndrome) confabulates plausible explanations to stitch moments into a livable narrative. The point isn’t deceit—it’s the brain’s need for coherence when evidence is missing. For a complementary lab demonstration, split-brain work by Gazzaniga shows a left-hemisphere “interpreter” that invents reasons for actions initiated outside its awareness—evidence that the narrative engine will supply a story on the fly. In everyday life the same coherence-seeking machinery runs in the background, but with intact memory it usually produces plausible, not pathological, narratives.
Taking Advantage of Idle Time
The generation of stories is a compute-intense process. It’s akin to the background processes of our computers that perform defrag, reindex, and garbage collection when they’re idle.
I believe that stories are really related sequences, sub-processes running in parallel as well as a hand-off to another processing (like making a function call). What makes them so effective as the differentiator between human and reptile intelligence is that these stories are intricately linked and relentlessly nested, which we’ll discuss later in the topic, Stories are Relentlessly Nested and Highly Parallel.
Sleep
That night of the day your boss asked for your TPS report, you dream of a birthday party—food, presents, friends—and your boss pops in with a gift. In the morning, a story has coalesced: someone gave a birthday present but didn’t receive one on theirs. A memory surfaces that yesterday was probably his birthday. Maybe he was hinting—consciously or not—or, more simply, he was being sarcastic since you’re perpetually late with TPS reports.
A large component of sleep supports learning and memory consolidation. Dreams appear to remix recent experiences and existing schemas, sometimes yielding new storylines. Recent events update our internal stories (from Version X to X+1) and can even compose new ones. Dreams are stories, not mere logs of events, often with roots in the previous day.
The next two mechanisms also organize stories in a largely automatic, background fashion, with feedback from the world providing the reinforcement.
Default Mode Network (DMN)
When we think we’re doing nothing, the brain is busy composing stories—much as cells repair themselves during sleep. Your mind turns inward—remembering something that happened, imagining tomorrow, or taking someone else’s perspective—and a coordinated set of brain regions switches on: the default mode network. It’s useful to picture it as a story workspace where you keep a running model of “what’s going on,” knit from scraps of memory, hints about the future, and your sense of other people. During real storytelling (listening to a podcast, reading a novel, watching a movie), this workspace retunes to follow the plot—tracking who did what, why it matters, and what might happen next—rather than merely echoing the words. The DMN typically down-shifts during externally demanding tasks and can couple with control and salience networks when stories must be integrated with action.
The DMN isn’t just where stories live; it’s where they’re updated. As new details arrive, the workspace revises the model so the whole thing still makes sense. When the model hits a gap—when a character’s choice or a business situation doesn’t add up—you feel curiosity. That curiosity recruits memory and motivation systems that bias learning toward the missing piece, making you more likely to notice, remember, and use exactly the information that would complete (or revise) the story you’re building. In that way, curiosity functions like a built-in “go fetch” button for the DMN’s unfinished narrative.
Practically, this is why stories are so powerful for thinking and decision-making: the DMN provides a place to hold the evolving picture, and curiosity keeps sending us back out to collect the next clue—so the picture can tighten, shift, or even be rewritten when reality demands it.
Sources of the Stories
As it is with anything AI, which always often comes with procuring and processing a massively wide variety of data (see Thousands of Senses), the big problem is how to feasibly create and maintain the complicated rules and wire them together to form a coherent and versatile intelligence—derived from a large amount of dynamic data. Most data in databases is produced through the activity of billions of people over the past few decades. In the case of LLMs, that came from the writings of hundreds of millions of people over thousands of years—albeit the vast majority of it produced recently.
Expert systems, knowledge graphs, and machine learning are traditionally crafted like independent works of art—the difference is that the “artists” are cross-functional teams, not individual artists like Renoir or Michaelangelo. However, the appearance of LLMs (and other generative AI) significantly accelerates the productivity of the human crafts people. That’s a critical relationship.
Projects and Support Cases
Almost anything a knowledge worker does can be thought of as a project (or sub project within a project). Some projects are intended to build something new, and some are about maintenance and support. I’m usually on both sides of that wall at the same time. I work on building new software systems and I also spent many years as a SQL Server Analysis Services (SSAS) field engineer.
With my SSAS field engineer cap on, I responded to customers with poorly performing SSAS servers and/or a solution to a feature that seemed impossible to implement. Each was a rich story consisting of the problem, how they got there, the fix or solution I crafted, and the recipe to implement it.
I was also very good at documenting the case for the customer, my organization (it went into a support knowledge base), and most importantly, for my own professional growth. Crafting a high-quality story of the adventure (consumable by people who don’t know the subject as well as I did) worked wonders on my skill level. I realized way back then that writing about something for public consumption (or teaching a class or) is really your graduation test.
I don’t believe many of the customers actually read my 30-50 page report, but I do know they came in handy very many times for the first-tier support folks. I do hope those reports have been trained into a private LLM today, even though architectures are much different now (most was pre-cloud) and so it’s probably not very helpful.
A big theme in my book is that almost everyone is a knowledge worker, someone who requires consumption of data to information applied within a substrate of expertise (knowledge, wisdom, and understanding). Therefore, we’re all consultants who resolve problems. There is a story behind every problem.
Processes, Procedures, Tools, Rules, and Exceptions
Behind every structure in an organization lies a story. What looks like bureaucracy or routine on the surface is usually the residue of past problems solved, lessons learned, or decisions made under pressure. If we ignore those stories, we miss the logic that shaped the system.
- Processes: A process is the broad arc, the narrative of how something gets done. Each step exists for a reason, even if the reason is long forgotten. For instance, the hiring process doesn’t exist just to generate paperwork—it reflects past failures, like hires who lacked the right access or training.
- Procedures: Procedures are recipes for tasks within a process. They spell out the “how.” The onboarding process, for example, may contain procedures for issuing a laptop, creating an email account, and walking through orientation. The procedure is narrower than the process but tells its own story about what went wrong when steps were skipped.
- Rules: Every rule is a scar from something bad that happened. A firewall restriction often traces back to a breach. A travel approval rule may come from one disastrous overspend. With time, the story is forgotten but the rule remains, like sediment hardened into rock.
- Tools: Tools have histories too. Why JIRA instead of Trello? Why Tableau instead of Power BI? Those choices were rarely random—they were born from pilots that worked, budgets that didn’t, or champions who pushed a tool into place. A tool is an artifact of decisions and trade-offs, not just a neutral instrument.
- Exceptions: Exceptions are rules that tell special stories. A “fast-track” approval was invented because once, someone critical was stuck in red tape. An “emergency deployment” path appeared after a deal was lost while waiting for the standard process. Exceptions remind us that even the best rules sometimes bend, and those bends leave their own narrative trace.
Unstructured Data
Beyond artifacts that clearly fit a category (a process diagram, a tool manual, a policy), organizations swim in unstructured stories: emails, Slack threads, meeting notes, PDFs, slide decks, spreadsheets used like documents, screenshots, photos of whiteboards, even recordings of hallway conversations. Each of these is an attempt to communicate a slice of reality—a situation, a reason, a decision, a risk. Historically, we skimmed or archived them and hoped search would be enough.
What changes the game is that LLMs can now read these narratives and draft structure from them. Given a pile of unstructured inputs, an LLM can:
- extract SBAR elements (what’s true now, how we got here, options/risks, what to do),
- lift objectives/KPIs and cause–effect links into a strategy map,
- map names and terms to IRIs and serialize the result in RDF/Turtle,
- and anchor the whole thing with provenance (which sentence, which slide, which timestamp) and confidence scores so a human can review quickly.
In my blog, The Effect of Recent AI Developments on BI Data Volume, I discuss how this is possible now with LLMs (albeit, this is now old news). Later, I’ll demonstrate the approach with a deliberately random, personal story—the kahili ginger that finally bloomed—to show how even a free-form narrative can be converted into a queryable, diffable encoded story that plugs into the larger enterprise knowledge graph.
Categorizations and Labels
There’s a story behind labels. Some labels, such as apple trees can be explained by their place within a taxonomy, the parts which can then be expanded upon with ontologies. But those parts of ontologies have names/labels with stories—for example the problem solved by branches, trunks, blossoms, apples, and roots. The personas, job roles, departments labels in the enterprise all have stories behind them.
A persona like “new data analyst” is really shorthand for a common story. A junior hire is told to pull a customer churn report. She discovers three dashboards with different numbers. She asks around, gets three different explanations, and wastes days piecing together which metric definition to trust. The problem isn’t her skill but the fractured environment she landed in.
A role like “data architect” carries its own story. A product team is rolling out features weekly, and every change breaks the downstream reporting tables. Analysts start building their own patches, and suddenly nobody knows which version is the truth. The architect steps in, documents the data contracts, sets up versioned schemas, and makes lineage visible. It doesn’t make the job glamorous, but it restores stability and frees the others to focus on their actual work.
Business Intelligence Data
Business Intelligence (BI) is about integrating highly curated BI data across domains of an enterprise. There are stories in that data—both BI and OLTP. It’s the stories of the effect of various metrics on other metrics. BI analysts harvest stories out of that data, hacking away at to form short stories for business stakeholders, presented as reports or slide decks. I believe we can define reusable templates of these short stories and generate them automatically as structured inputs to LMs.
Within all that business intelligence data are stories such as the demise of a cherished product, a story of how market share could we recaptured. More realistically, the BI data might contain pieces of the story, clues, which the BI analyst can fill in with the human intelligence of herself and colleagues.
Stories convey reasoning and context far better than step by step recipes or news articles that only blurt out facts about an event. That is the foundation of my first book, Enterprise Intelligence.
My second book, Time Molecules, extends that idea to the world of event processing (event hubs) that receive a highly heterogenous mix of data from myriad IoT devices, AI agents, humans, and software applications. I start from the premise that everything is an event (something the event sourcing crowd will appreciate)—and that each event can be abstracted as a case, a date, an event type, and a bag of event-specific and case-specific properties. Inspired by process mining and systems thinking, we uncover the stories—the processes—unfolding across time that we may not be aware of.
From the efforts of process mining, fueled by a systems-thinking mentality, stories of what really happens in this world are derived. The first take is as Markov models, which provide the probabilities of what events happen after a given event. From the Markov models, we can generally extract the most probable flow of events. But we can also extract unusual flows, each of which carries some variation of the story of an experience.
Strategy Maps, SBAR, RDF, and LLMs
Here we will discuss technologies for encoding stories into a machine-readable format and decoding back to text.
In Chapter 15 (Artificial Consultant to a Consultant) of my book, Time Molecules, I present how to use a strategy map as the primary artifact of an engagement to resolve complicated and even complex problems. Meaning, there are multiple, competing goals—that’s what makes any story interesting and potentially useful.
Unfortunately, like all translated information, the translations probably will not be lossless—some level is lost in translation. But we compensate through protocols of syncing, getting on the same page.
Strategy Maps – What Gives Stories their Meaning
Before we talk about stories in general and how to encode them into a knowledge graph, we need to discuss a special kind of story, the piece that gives meaning to those stories. Meaning is the relevance to the enterprise which includes goals we hope to achieve, objectives we need to accomplish as we execute a plan towards the goals, and risks we wish to avoid. This is composed into a structure of relationships—usually conflicting relationships—called a strategy map.
A strategy map is from the Performance Management world. But in this application, it should be called a story map. A strategy is a kind of story—a story about how to relieve some sort of pain, solve a problem. Some stories are about how and/or why something works. In whatever form, they are a web of cause and effect (at least hypothetical cause and effect). Because a story encompasses something more than a strategy and strategies take place over time (therefore are not a map of things), we’ll call a strategy map adjusted for stories “encoded stories”.
Strategy maps were introduced by Robert S. Kaplan and David P. Norton as part of the Balanced Scorecard to visually communicate the story of a strategy—linking strategic objectives in explicit cause-and-effect relationships so people can see how value is created across the organization. Their HBR article framed maps as a way to depict critical objectives and the relationships among them, and their 2004 book systematized the idea as a primary artifact for describing and executing strategy.
In my blog, Beyond Ontologies: OODA Loop Knowledge Graph Structures, I discuss strategy maps as a structure that should be included in an extensive enterprise knowledge graph.
Strategy Maps are graphs of relationships between KPIs, meticulously formed from human intelligence. That includes cross-functional teams interviewing business stakeholders, subject matter experts, and front-line workers. Hopefully the interviews involve more than reciting the steps they take, for example:
“I take the specifications from the customers and bring them down to the software engineers.” – Tom Smykowski, Office Space.
Rather, it includes stories of why they do something the way they do it. In fairness to Tom, he did provide the key insight into purpose of his role:
“I deal with the goddamn customers so the engineers don’t have to. I have people skills; I am good at dealing with people.”
Part III of my virtual book, The Assemblage of Artificial Intelligence, Artificial Goals and Feelings, is a list of blogs I’ve written on the subject of strategy maps.
Business Example of a Strategy Map
Figure 1 is an example of a strategy map I’ve used in many other blogs and my books. It is pretty much a relational view of the collection of KPIs of a performance management system, as opposed to the taxonomic (list) view of a typical Balanced Scorecard. But it’s a view that tells a story, which is beyond how metrics roll up into objectives that the usual balanced scorecard shows. The relationships between the KPIs tell the story of the theory of the business.
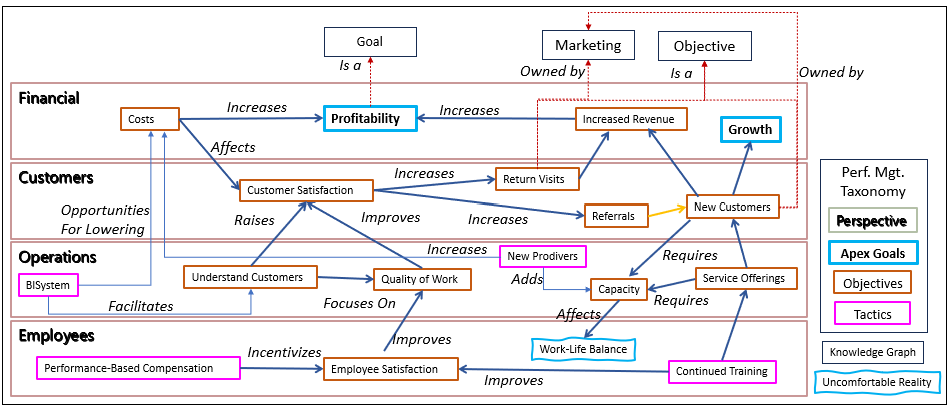
The RDF equivalent of this strategy map illustrated by Figure 1 is stored on the GitHub repository for this blog and can be viewed in an RDF tool such as Protege. I also discuss this strategy map in more detail in Chapter 10 of Enterprise Intelligence.
If you think of the things you desire and enjoy, your personal goals, the things you are afraid of—all of which are often in conflict, resulting in all sorts of flavors of how you’re feeling—the function of the strategy map should make sense. Without it, stories just don’t have any meaning.
Strategy Maps for Context Engineering
A couple of weeks before writing this blog, I first heard the term, Context Engineering. It is the work of giving data a usable mind—enough structure that an agent (or a human) can infer intent, weigh trade-offs, and act without wandering as a process proceeds. The strategy map is a powerful kind of expression of context—a map of intended cause and effect. We could think of a strategy map as a simplistic theory of mind of the enterprise.
Each node is a goal (what we want), each attached KPI is a measurable signal—think pain levels for the enterprise. Edges are our hypotheses about how the world moves: if we do X, Y should improve. Some edges are obvious levers, some are gotchas (unintended side effects), and many collide because goals compete—speed vs margin, conversion vs support load.
Goal nodes express desires. Risks (goal of avoiding something) express fears. KPIs fire when things feel good or bad—edges encode expectations about others in the system (customers, ops, finance) and how they’ll react. We measure the validity of each relationship (intended cause and effect) with the Effect Correlation Score—a read on how true the relationship appears to be in the current data (a correlation metric of how closely the status value of the two KPIs go up and down together).
What I just described is just an aspect of context engineering. But to help clarify this notion of a strategy map’s usefulness in context engineering, I pasted Figure 1 in ChatGPT and asked:
In the context of the AI notion of “Context Engineering”, how valuable is this strategy map in discussions of how we might improve quality of life for our employees?
It seemed to agree. The full response is the file, strategy_map_context_engineering.pdf, on the GitHub repository.
SBAR for Good Storytelling
SBAR began as a communication scaffold for high-stakes environments (such as handoffs in hospitals and submarines). Its power is simplicity: one shared order—Situation, Background, Assessment, Recommendation—so people hear the same story, in the same sequence, every time. In strategy work, SBAR shines because it mirrors how leaders think under time pressure: What’s true right now? How did we get here? What should we make of it? What do you want me to do? Used with a strategy map as the visual spine, SBAR keeps discussions focused, comparable across meetings, and easy to recall.
- Situation — what is true right now: Open with the present tense. Show the current strategy map exactly as it stands today: the objectives/KPIs on the canvas and the cause-and-effect links that currently exist between them. Add the latest KPI readings and trends so people see level, direction, and owner at a glance. Resist the urge to edit or speculate here; the purpose is alignment on facts. By the end of this section, everyone should agree on the baseline story the organization is living in right now.
- Background — how we got here: Give just enough history to make the present make sense. Briefly contrast a prior map with the current one and name the key events that pushed the system from “then” to “now” (policy shifts, market moves, operational constraints, seasonality). Keep this explanatory, not prescriptive: Background is for context, not redesign. You are answering, “What changed, and when?” so that the current map in Situation is no longer surprising.
- Assessment — what it means, and what we can and cannot change: Explore the situation in terms of choices. Identify the levers you can actually pull (drivers), the boundaries you must respect (constraints), and the principal risks and potential rewards. If helpful, outline a small set of scenarios with expected effects and rough likelihoods. Use data and observations to support why the system behaves as it does, but still avoid altering the map. Assessment prepares the decision; it does not make it.
- Recommendation — what to change and why: Prescribe the treatment. Name the actions, assign ownership and timing, and show the proposed changes to the strategy map—what links will be added, strengthened, or removed. Make the propagation explicit from action to targeted KPI to downstream outcomes, and state how risks will be mitigated. This is the only place the causal structure is altered: Recommendation introduces the deltas that turn the analysis into a testable plan.
SBAR Example: The Symbiotic Relationship between LLMs and Knowledge Graphs
LLMs and Knowledge Graphs (KGs) have developed a truly symbiotic relationship. LLMs, with their broad exposure to human writing, make the creation and upkeep of KGs far more practical by surfacing hidden connections, generating triples, and smoothing out the traditionally labor-intensive mapping of concepts.
In turn, KGs provide the grounding that LLMs inherently lack, tethering their predictive “book smarts” to vetted, structured knowledge about real-world entities and processes. Without the rise of readily accessible LLMs, KGs might still be pie-in-the-sky projects requiring immense manual effort. And without KGs, LLMs would remain clever mimics prone to hallucination. Together, they form the mortar that binds fragmented information into an enterprise-scale fabric of intelligence.
Here is an example of a very fitting story for this blog, presented in an SBAR structure. It’s the story of the symbiotic relationship between knowledge graph creation and LLMs that I mentioned earlier. I asked ChatGPT to create the SBAR example from a topic within Chapter 4 of Enterprise Intelligence on that symbiotic relationship. It did a pretty good job of applying this rough level of structure to a few pages of text:
Situation
When I first began exploring enterprise knowledge graphs, the whole idea felt more like a dream than something practical. The construction effort seemed impossibly large, with too many moving parts and too many voices to reconcile. Then, almost out of nowhere, LLMs arrived on the scene. Overnight, they offered a way to sketch relationships between concepts that used to take teams of specialists months to map. The question became clear: could these generative models finally make knowledge graphs real?Background
Knowledge graphs are intended to be the brain of an organization—connecting processes, departments, and data into something coherent and navigable. Yet they’ve always been elusive. Ontologies and taxonomies provide the scaffolding, but maintaining a living, evolving graph across an enterprise was often out of reach. The sheer volume of unstructured data, the contradictions between perspectives, and the heavy human effort meant that even well-funded initiatives stalled. Meanwhile, LLMs entered the world not as perfect intelligences, but as voracious readers of our collective writing—astonishingly book-smart, if occasionally error-prone.Assessment
It turns out that these two seemingly different innovations need each other. LLMs are “smart enough” to accelerate the grunt work of graph creation—extracting triples, smoothing mappings, proposing links where human eyes would struggle. Without them, KGs remain heavy lifts. But without KGs, LLMs drift untethered, prone to hallucination. Put them together, and you get a powerful feedback loop: the LLM accelerates construction and maintenance of the KG, while the KG grounds the LLM in the vetted, structured reality of the enterprise. The mortar finally appears between the once-fragmented bricks of BI, metadata, and domain expertise.Recommendation
The path forward is to treat LLMs and KGs not as rivals but as partners. Let LLMs do what they do best—surface connections, draft mappings, and comb through oceans of unstructured data. Then rely on KGs to anchor that output, giving the enterprise a durable, navigable structure. This symbiotic relationship doesn’t just make KGs feasible; it turns them into the Holy Grail of analytics, a living model of the business itself. And it reframes LLMs, not as replacements for human intelligence, but as interns who never sleep, assisting in building the neural framework of organizational knowledge.
Now let’s look at a further level of transformation. That is in the form of a semantic web.
Semantic Web (RDF)
Knowledge graphs are ideally serialized in RDF (Resource Description Framework). RDF represents knowledge as a graph of triples—subject, predicate, object—so your strategy map (objectives and cause-effect links) and SBAR panes (S/B/A/R as typed nodes) fit naturally. Using IRIs (web identifiers) for classes, individuals, and relationships lets you name things unambiguously and link them to external definitions (ex. a KPI in a standard vocabulary) or to other internal stories. RDF gives your story a portable, machine-readable skeleton that tools can query, diff, and reuse.
We serialize in Turtle (.ttl extension), a compact, human-readable RDF syntax, so the model is easy to read, diff, and load into tools. Two add-ons make this especially relevant here:
- OWL (Web Ontology Language) provides a light layer of semantics so you can declare what counts as an Objective, Action, Risk, etc., and enforce simple rules (ex. “only R introduces new causal links”) with shapes or constraints.
- SPARQL lets you pull exactly the views you need— “show edges added in R,” “list actions and targeted KPIs,” or “compare prior and current maps”. Together, RDF + Turtle + OWL + SPARQL turn a slide-deck story into a governed, queryable asset that can dock to an Enterprise Knowledge Graph and link out following Linked Data principles.
We’ll look at an example of a knowledge graph encoded in RDF soon. But first, let’s discuss LLMs, which will demonstrate the symbiotic relationship between LLMs and knowledge graphs.
LLMs are the Skillful, Domain-Sensitive Translators
LLMs are wonderful as skilled translators between our human brains and the overwhelming landscape of large enterprise knowledge graphs. They are more than just like a translator who can translate between, say English and Japanese. Some words and concepts have no direct translation and some are more sensitive to certain contexts than others.
Even more, an ideal translator is also knowledgeable of the subject domain of what they are translating. They can catch potential areas of misunderstanding, the nuances of the domain that won’t translate well. Although LLMs are still not creative geniuses, they know more about more things than any human I know. In the role of translator, LLMs don’t need to be the super geniuses. But they’re wide breadth of training means they can fit in with almost any highly technical conversation.
Another kind of useful translation is to take unstructured text and organize it. That can include extracting objects and their roles, summarizing, and reshaping the text into an SBAR format. Examples of the raw unstructured text are email threads, chat group threads, recorded conversations, minutes (transcriptions today), and notepads. That is, conversations that don’t follow formal processes—they are the informal conversations that take place between real people in the real world.
For me, another example is a braindump I write every morning as soon as I get up. My mind is full of thoughts that were resolved or popped in during the magic of sleep. These braindumps aren’t in any particular order (I jot down these thoughts as it pops into my attention), aren’t entirely articulate, and some things might be pure garbage. But I ask ChatGPT to try its hand at fixing up my braindump so we have something cleaner to work on. Although it misunderstands about a third of the content, that is still useful information—it could mean it’s a novel thought, my braindump didn’t adequately capture my thought, or yes, it’s garbage.
In the context of this blog, LLMs are pretty good at taking that raw text and organizing it into an SBAR format. To review, in the SBAR format, we’ve extracted these essential elements of a problem and solution:
- Situation: The problem and the context.
- Background: How we got here, what has changed.
- Assessment/Analysis: What do we have to work with, develop our options, what are the risks for each option, what are the benefits vs. risks?
- Recommendation: The exact prescription, script, recipe.
The SBAR format is still text, but we’ve ensured it includes the key elements of a problem for which we’re seeking a solution. It’s a halfway point between the raw, organic, in-no-particular-order conversations that goes on in real life and the formalized encoding of an RDF knowledge graph.
Example of LLM and RDF-Encoded Knowledge Graph
Let’s look at a fun, very familiar to everyone, and relatively simple concept to demonstrate the symbiotic relationship between LLMs and knowledge graphs: The McDonald’s hamburger. Don’t laugh. as awful as it might be to some, it was a key player in the rise of massive franchising.
Because of its significance in business history, it’s helpful to know the story of how the McDonald’s hamburger came to be. Why is it still around when there are clearly readily obtainable burgers at many places that are magnitudes better? It boggles my mind, so I asked ChatGPT for some help on the theory of the McDonald’s hamburger. Here is the response:
The “McDonald’s hamburger” isn’t a single node; it’s a bundle of stories that run in parallel and reinforce each other:
- Predictability story. “Anywhere on earth, it tastes the same.” That’s a trust narrative: when uncertainty is high (travel, late night, kids melting down), a known outcome beats a possibly better one with risk.
- Access & speed story. Ubiquity + drive-thru + short cycle times. The job-to-be-done isn’t “best burger,” it’s “solve hunger now, predictably.” In that job, conformance to spec is quality.
- Price & anchoring story. A low, transparent price tells a fairness tale. Promotions (bundles, app deals) keep the “good deal” story fresh even as costs move.
- Taste engineering story. Salt/fat/umami, a touch of sweetness, acid from pickles—designed reliability of a flavor profile that lands for huge swaths of people. Not peak culinary artistry—peak repeatability.
- Childhood & ritual story. Road trips, Happy Meals, the smell of fries, birthday parties. Those early episodes become comfort cues later.
- Place & safety story. Clean bathrooms on highways, lit parking lots, consistent hours. For many, McDonald’s is infrastructure as much as restaurant.
- Cultural symbol story. It’s a reference in jokes, movies, memes—a shorthand for “baseline burger.” Being the reference point keeps it in the conversation that sustains it.
That sounds like a plausible theory of the McDonald’s hamburger to me! But I’d like it organized into a coherent format (i.e. SBAR). So I complimented ChatGPT on the result and asked it to convert it into an SBAR format. Here is the result:
Situation — what is true right now
McDonald’s hamburgers remain a default choice in many contexts despite plentiful “better” burgers. The present pattern is defined by ubiquity and predictability: consistent taste worldwide, fast service, reliable hours, drive-thrus, and a low, transparent price. For many people, McDonald’s functions as infrastructure (bathrooms, lighting, parking, kid-friendly options), not just a restaurant. The brand sits as the reference point in culture—jokes, movies, memes—which keeps it top-of-mind.
Background — how we got here
Decades of process standardization and global expansion built the “anywhere on earth, it tastes the same” trust story. Childhood episodes—Happy Meals, road trips, birthday parties—seeded nostalgia and ritual that later operate as comfort cues. Price discipline and promotions established the “good deal” anchor. Over time, these strands reinforced each other: place + speed + predictability became the McDonald’s baseline.
Assessment — what it means; levers, constraints, risks
- Drivers/levers (manipulable): Availability (store density, hours), Speed (drive-thru throughput), Predictability (process control), Price/Deals (bundling, app offers), Taste Engineering (salt/fat/umami balance), Experience Cues (clean bathrooms, lighting, kid options).
- Constraints (less manipulable): Real estate and labor markets; cultural positioning as the “baseline burger” (hard to pivot to “gourmet” without breaking the story).
- Risks: Health perception; competitive “better burger” narratives; operational misses that erode trust (slow lines, inconsistent quality).
- Interpretation: The “job-to-be-done” is often “solve hunger now, predictably and affordably,” not “best possible burger.” In that job, conformance to spec is the quality that matters. Nostalgia/ritual provide long-memory loops that keep the choice sticky.
Recommendation — what to do and why (story-consistent moves)
Keep optimizing the Availability → Predictability → Trust → Habit pathway, with Price and Speed as reinforcing drivers and Nostalgia/Ritual as retention loops. Concretely:
- Protect predictability (process control, training) so flavor and service remain reliable under load.
- Speed as a promise (queue tooling, drive-thru flow) to win the “solve hunger now” job.
- Price signaling (simple bundles, app deals) to maintain the “fair value” story.
- Ritual cues (clean facilities, kid-friendly touches, travel convenience) to refresh nostalgia without heavy spend.
- Selective taste tweaks that keep the engineered profile consistent while meeting local preferences—never at the expense of reliability.
This preserves the nested stories that actually drive the choice, rather than chasing “best burger” accolades that compete on a different story entirely.
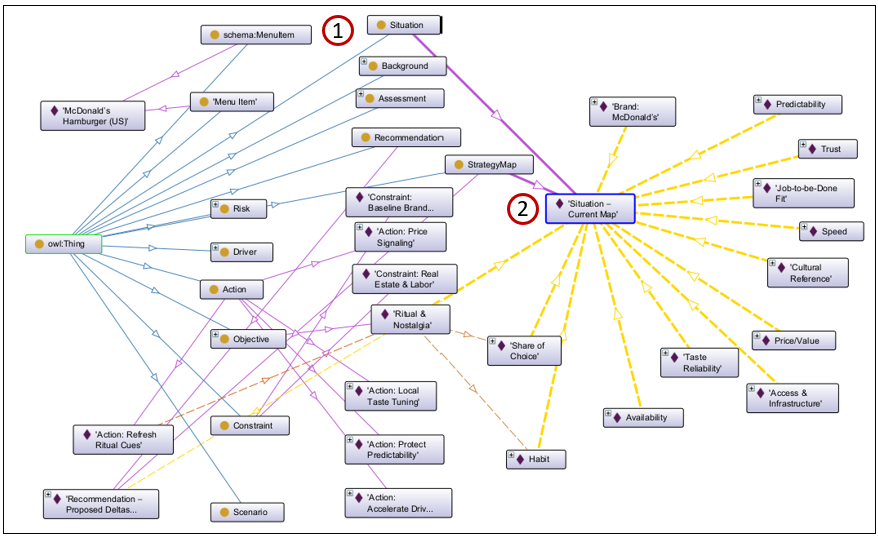
With a more organized SBAR format, I then asked it to convert it into an RDF version of that theory, which you can view from the GitHub repository. That RDF can be incorporated it onto an EKG, enriching its breadth of knowledge. Figure 2 is a visualization through Stanford’s Protege application:
- The Situation (the S in SBAR) node.
- The hub node for all the parts explaining the situation that comprises the McDonald’s hamburger.
Linked Stories
The main idea is that the RDF from Figure A is uploaded into an integrated Enterprise Knowledge Graph—housed in an enterprise-class graph database such as Neo4j—where it’s linked to:
- Ontologies and taxonomies, which enrich the meaning of the labels and relationships of the strategy map.
- An enterprise-wide data catalog, which links the labels to enterprise databases.
- A large web of cached relationships between aspects of data and insights.
- Other stories.
The first three items are the subject of my book, Enterprise Intelligence, which is about the construction of an knowledge graph that is beyond the traditional ontologies and taxonomies, and from across all domains of an enterprise.
When we’re first told a story, it often lands only at the surface. The meaning is thin, almost like scaffolding. But when we return later—armed with more experiences, more connections in our own web of stories—the same tale resonates at a deeper level.
For me, books like The Little Prince by Antoine de Saint-Exupéry and Siddhartha by Hermann Hesse have worked that way. As C.S. Lewis observed, the best stories grow with us—youth, adulthood, and old age each draw out different truths. I’ve read them at different stages of my life, and each time I found layers I couldn’t possibly have seen earlier. The stories haven’t changed, but our capacity to link them to other stories and insights has.
A Couple of IRI Notes
Although this might be a bit out of scope for this blog, I thought I’d take the opportunity to show you more about how concepts link in the semantic web. This can be a really deep rabbit hole. I do cover this in Enterprise Intelligence. But I’d like to just present the main idea of IRIs.
Note that in that RDF of the theory of McDonald’s hamburgers is this definition. Figure 3 shows how this looks in the .TTL file:
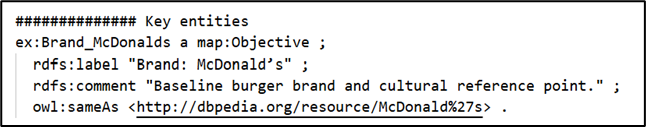
DBpedia is a long-running project that turns Wikipedia’s infoboxes into a linked data knowledge graph. Each real-world thing gets a stable IRI (Internationalized Resource Identifier)—a global, web-addressable name—so other datasets can point to the same thing instead of inventing their own. That’s the main idea of IRIs: they’re unique, web-scale identifiers that different graphs can share.
In Figure 3, the URL http://dbpedia.org/resource/McDonald%27s is the IRI for McDonald’s (the company). If you open it in a browser, you’ll see a human-readable page; to machines, the very same IRI can return structured RDF (e.g., Turtle/JSON-LD) via content negotiation or format hints. Because the IRI is shared, you can link your story graph to DBpedia (or Wikidata, etc.) with predicates like owl:sameAs or skos:exactMatch and instantly inherit a network of connections (locations, founders, products)—a powerful way to show “how concepts link” without duplicating data.
A more complicated example is with McDonald’s hamburgers themselves, which don’t have a single entry as McDonald’s the corporation, https://www.mcdonalds.com/us/en-us/product/hamburger.html. Figure 4 shows what that looks like in the .TTL file.
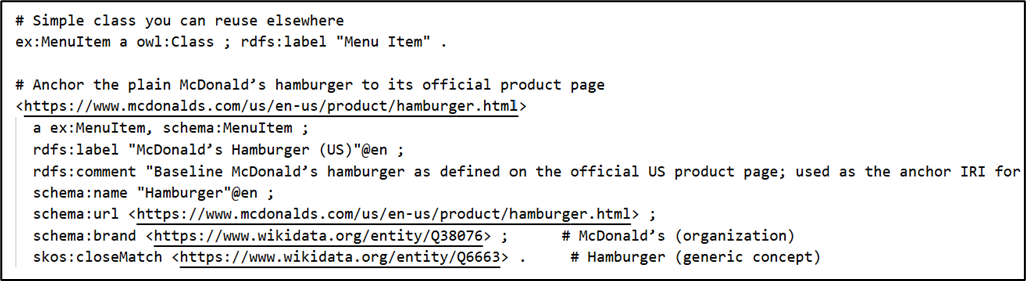
In this case, since the McDonald’s web site has a page solely about the basic hamburger, I chose to use it as the IRI for the McDonald’s hamburger, since I assume McDonald’s is the most authoritative page for its own products.
Abductive Reasoning and Chains of Strong Correlations
Think of Sherlock Holmes summoned to a crime scene that is stumping the best detectives of Scotland Yard. He explores the scene with an empty mind, putting aside any dozens of types of biases for the time being—failure to do that is the first blunder of the detectives. In every conversation, he listens much more than he asks questions. His genius for solving cases is based on his methodology that is well beyond collecting known unknowns, but a matter of unknown unknowns.
He next lets his mind freely wander, finding relationships between his collection of clues built from his extensively rich knowledge base of experience. Equally important, he’s sensitive to weak signals of correlation that most would discard because weak means improbable, or even impossible for the most closed-minded. These weak signals are candy to his insatiable curiosity. It drives him to seek out more information about these weak signals.
Eventually, he has a map of relationships (a web of correlations) from which the novel story of a solution to his novel crime is lifted. He iteratively formulates hypotheses, which he validates through deductive reasoning. Hypotheses that fail deduction—lead to illogical conclusions—are tossed aside. If he does this well, as he says:
“[To Watson] How often have I said to you that when you have eliminated the impossible, whatever remains, however improbable, must be the truth?” — Sherlock Holmes, The Sign of the Four, ch. 6 (1890).
What is pulled out of the big web of correlations are chains of strong correlations that connect the end result (the crime Holmes is investigating) to not just the perpetrator (a mere fact), but the story of why and how.
There are two primary structures I lay out in Enterprise Intelligence that support this process:
- Insight Space Graph—The BI queries of users across all domains of an enterprise and captured. The results are run through the Insight Function Array, a set of functions that extracts whatever would be noticed in a BI query result across all BI visualizations (line graphs, bar charts, scatter plots, etc.) and simple, low-compute ML models.
- Tuple Correlation Web (TCW)—A web of correlation scores between things (tuples). Each row of a BI query actually defines a tuple. For example, a result set could be the sales of Big Macs for each country or volume of bourbon consumed by each religion. From each set, we could select a tuple: Sale of Big Macs in Vietnam and volume of bourbon consumed in Argentina. Howe closely do the metrics of those two tuples go up and down together? Perhaps there is some weird moderate correlation, more than we thought.
For a fuller explanation of this topic of abductive reasoning, please read the blogs:
- Exploring the Higher Levels of Bloom’s Taxonomy – An explanation of abductive reasoning in contrast to the more familiar inductive and deductive reasoning.
- Correlation is a Hint Towards Causation – Provides examples of abductively formulating stories derived from chains of strong correlations.
This is a big topic in my book, Enterprise Intelligence, particularly the chapter, “The Tuple Correlation Web”.
Stories are Relentlessly Nested and Highly Parallel
Linking stories isn’t just tying together nodes that refer to the same entity across narratives (coreference)—for example, the “mention” of McDonald’s hamburgers appearing in multiple stories. The deeper issue is that most nodes in a story are themselves stories: scenes, episodes, motifs, and analogies. Words used in a story carry layers of context that go well beyond their dictionary definitions.
This is akin to the web’s graph of pages and hyperlinks: words, phrases, and references send you from one page to another (to another, to another…). You read a page, click a link, follow a trail, then return and pick up where you left off. The structure is densely interlinked, but your traversal is still sequential.
Simple stories often follow a single arc; richer stories braid several arcs that resolve together. While we read those arcs in a serial fashion—part of one arc, then a switch to another—the underlying structure can be parallel. Our focused, conscious processing is largely serial (working-memory bottleneck), while background cognition runs many processes in parallel. Likewise, computation can pursue parallel threads via daemons or AI agents and integrate them as a coherent whole.
The AI Version of Analog vs. Digital
Knowledge graphs reduce concepts to object-relationship-object triples. It strips out nuance of the objects and relationships injected through our personalities and the general vibe around the creation of the strategy maps. This is like how guitar tablatures are easy to understand, but unless you’re Mozart, you still need to hear the recording to fill it what a bunch of symbols fails to convey.
But this goes for all data which follow data schemas—relational databases, data warehouses, CSV files, even JSON. JSON is meant to be more flexible (open-schema), but even then, everything is polished to symbols. Data, at least today, is stripped of the thousands of nuanced connections related to the unique and extradentary complex set of experiences which are still encoded in our neurons and synapses.
However, LLMs can attempt to rehydrate a knowledge graph story with its vast incorporation of our human culture through the assimilation of the corpus of human text.
Encoding and Decoding of a Story
In the context of this blog, the role LLMs play is turning a unique, text-based story into code, RDF code. So let’s do a few experiments to demonstrate how effective LLMs are at translating between written stories, an SBAR version of the story, and RDF.
Text to RDF in an SBAR
This story is front of my mind right now. It’s a gardening event only known to my wife and me. I wrote the story of our 22 year old attempt at blooming our kahili ginger in the high desert climate of Boise. Figure 5 is a picture of that flower that began blooming on September 23, 2025.

Here is the story:
Our poor ginger wouldn’t bloom through 22 years of trying!
I bought a kahili ginger root (one of those few inch souvenirs) at Hilo Hattie on my way home from visiting my mom on Oʻahu in 2003. For twenty-two years it never bloomed, although it would grow very nicely and looked very healthy.
Where we live, Boise, I knew the dry, hot summers and very cold winters would be rough on a tropical plant. From mid-May to early October I kept it outside under a tree with my ti plants—partially shaded from the sun, a slightly cooler micro-climate, and hit by the sprinklers most days. The rest of the year it lived in the garage with other plants—not freezing, but still refrigerator-cold. Because it had to move so much, it stayed in a pot that I repotted several times as it outgrew each one. I brought it into the house a few times, but it was too dry and it took up too much room. Still no blooms.
Three years ago, around September (a month before I needed to bring it in) we finally saw a bud, but it didn’t have time to open before it dried up—that was one of the years I had moved it indoors, so that didn’t help.
This year I did something different. The plant had grown too big to sit under the tree along with the ti plants without blocking the sprinklers, so I put it in the only space we had where it would get a few hours of direct sun. I was ready to give up anyway. To offset the heat, I misted and watered the leaves during those sunny hours to cool it, and I fed it with an organic fertilizer from our local Zamzows.
A few weeks ago (in late july) a bud appeared—earlier than the other two years. We still figured it would dry up. It began to open with no flowers showing, and then one day a green bract pushed out a flower, then another, climbing upward until we had a full spike.
I can’t say for sure why it finally bloomed, but my best guess is that I’d been protecting it from the very thing it needed: more sun. I assumed Boise’s desert light would be too harsh for something that evolved in humid, tropical weather. Most of the winning changes happened after I’d essentially given up—forced to try a new spot, then compensating for the risk with leaf-cooling and fertilizer.
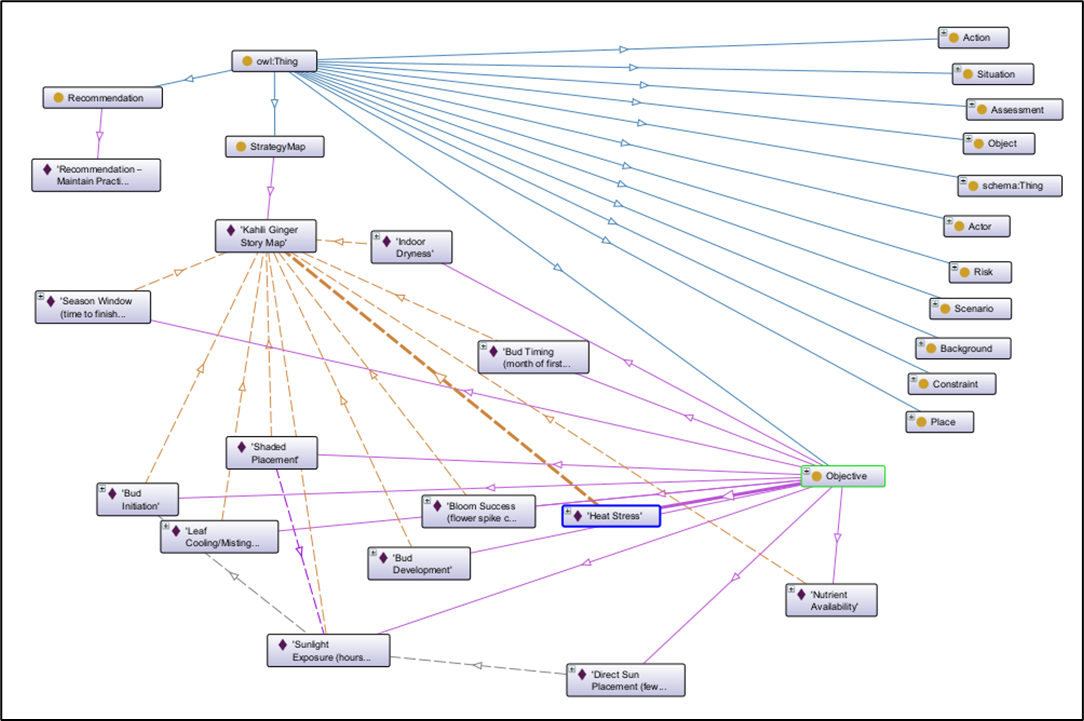
I presented the story of my kahili ginger to ChatGPT prepended with a prompt:
Here is a test I’m hoping you will do great at. the story of the ginger. I’d like you to make a story map (a strategy map) of the story. it will be in RDF (resource description framework) as we’ve been doing. I hope you spit out a perfect one. I should be able to use it as a visual when explaining to people how the ginger finally bloomed. So it has to represent the story closely enough. This is a PoC on using an LLM to create a draft (hopefully a really good one) from a text story: <pasted the story above here>
ChatGPT responded with the RDF, kahili_ginger_bloom.ttl, which is on the GitHub repository.
RDF to Text
The important test is to see if we’re able to convert that RDF—which enables us to link it to a knowledge graph—back to a text story. I presented this prompt to Grok:
Could you look at this RDF file and craft the story it’s trying to tell: <pasted the rdf contents>
Grok’s response is surprisingly good:
The RDF file tells the story of a 22-year journey to achieve the first bloom of a Kahili ginger plant (Hedychium gardnerianum) in Boise, Idaho, using an SBAR (Situation, Background, Assessment, Recommendation) framework to map the narrative and strategy. Here’s the story it conveys, woven from the RDF’s entities, relationships, and objectives:
In 2003, an avid gardener, referred to as the Owner, purchased a Kahili ginger root as a souvenir from Hilo Hattie in Oʻahu, Hawaii. Enchanted by its potential, they brought it to Boise, Idaho, a place with a challenging climate—hot, dry summers, bitterly cold winters, and a short outdoor growing season from mid-May to early October. The goal was to nurture this tropical plant to bloom, a feat that proved elusive for over two decades.For years, the ginger thrived vegetatively under a tree in partial shade, protected from Boise’s intense sun but limited by low sunlight and occasional sprinkler blockage due to its placement. Each summer, it was placed outdoors; in winter, it was moved to a garage or occasionally indoors, where dry conditions hindered its progress. In prior years, buds appeared in September, tantalizingly close to blooming, but they dried out before opening, thwarted by late timing and the need to move the plant indoors as Boise’s cold set in.The gardener faced several constraints: Boise’s climate imposed a short growing season and risks of desiccation or sunburn from excessive sun exposure. The under-tree location, while safe, limited sunlight, and alternative spots were scarce due to space and layout issues. Risks loomed large—desiccation could scorch the plant, and late budding risked missing the season’s window for bloom completion.By 2025, the gardener’s strategy evolved through trial and error. They analyzed key drivers: sunlight exposure, heat stress, leaf cooling, nutrient availability, soil moisture, and bud timing. Three scenarios emerged: sticking with the shaded status quo (low sunlight, unlikely to bloom), moving to full sun without cooling (risking heat stress), or a balanced approach with a few hours of direct sun, leaf misting for cooling, and organic fertilizer to boost nutrients. The gardener chose the third path.
In 2025, they relocated the plant to a spot with limited direct sunlight, overcoming the sprinkler blockage issue caused by its size. They misted the leaves during sunny hours to mitigate heat stress and applied organic fertilizer (Zamzow’s brand) to support growth. These actions targeted critical objectives: increasing sunlight exposure to initiate buds, cooling leaves to reduce heat stress, and providing nutrients for bud development. The timing was crucial—buds needed to form early enough to develop within Boise’s short season.
The strategy paid off. In late July 2025, a bud appeared, earlier than in previous years. Through careful maintenance of soil moisture and continued misting, the flower spike progressed through August, culminating in the plant’s first successful bloom—a vibrant triumph after 22 years of persistence. The gardener’s assessment identified the winning formula: a few hours of direct sun, active leaf cooling, organic feeding, and early bud timing. Their recommendation was clear—maintain these practices to ensure future blooms.
The RDF structures this narrative as a strategy map, linking actions (e.g., moving to sun, misting leaves) to objectives (e.g., sunlight exposure, bud development) and outcomes (bloom success). It captures causal relationships (e.g., sunlight causes bud initiation) and inhibitors (e.g., heat stress hinders bud development), while quantifying risks and scenarios with probabilities and expected outcomes. The SBAR framework organizes the story: the Situation celebrates the 2025 bloom, the Background recounts the long struggle, the Assessment analyzes drivers and risks, and the Recommendation cements the successful approach. This is a tale of patience, adaptation, and eventual victory over environmental odds, told through the lens of a gardener’s strategic persistence.
I didn’t expect Grok’s interpretation to be this good. It never saw the original story I told to ChatGPT from which the RDF was created. But I imagine there would be a somewhat more iterations for a more complicated story.
Text to SBAR with Enrichment
For this experiment, let’s see how an LLM can reformat text to organized as an SBAR. In this case, we’re not presenting it with a full story. Just a quote from a well-known move. Remember Tom’s quote from the movie, Office Space? Here’s the fuller quote:
Bob Slydell: “What would you say… you do here?”
Tom Smykowski: “Well, look. I already told you! I deal with the goddamn customers so the engineers don’t have to. I have people skills; I am good at dealing with people. Can’t you understand that? What the hell is wrong with you people?!”Earlier in the same scene he explains:
Tom Smykowski: “I take the specifications from the customers and bring them down to the software engineers. The engineers are not good at dealing with customers, so I’m the one who communicates between them.”
I asked ChatGPT to take just his quote and compose the story, an SBAR justification, for his role:
Situation: Customers need requirements translated into workable specs; engineers don’t want/shouldn’t handle customer interactions.
Background: Tom sits between customers and developers. He gathers requirements, clarifies intent, and conveys changes—historically acting as the liaison.
Assessment: Value: reduces miscommunication, shields engineers from churn, keeps stakeholders aligned. Risk: adds a layer—can become a bottleneck if Tom relays without adding clarity.
Recommendation: Keep Tom as the communication bridge, but formalize it: structured intake (templates), traceable specs, and direct engineer touchpoints for edge cases to avoid telephone-game distortion.
ChatGPT (LLMs in general) enriched the information with the knowledge it assimilated from the corpus of human text it was trained with. To compose the full story, we needed the ability to infer that the quote is in the context of an IT department reorganization and knowledge of roles in an IT department
Let’s try one more experiment. We’ll circle back to our McDonald’s hamburger RDF and ask Grok to tell us what it’s about. Prompt to Grok:
Could you look at this RDF file and craft the story it’s trying to tell: <pasted the rdf contents>
Here is Grok’s response:
This RDF ontology describes a strategic analysis of the McDonald’s hamburger using the SBAR (Situation, Background, Assessment, Recommendation) framework and a strategy map. It explains why the baseline McDonald’s hamburger persists as a dominant product by modeling its success through a causal network of objectives, drivers, constraints, risks, and proposed actions.Key Components:
- Ontology Overview:
- Focuses on the McDonald’s hamburger as a core menu item, linked to its official US product page.
- Uses a strategy map to outline why the hamburger remains a customer choice, emphasizing factors like availability, predictability, trust, and habit, reinforced by speed, price, ritual, and cultural significance.
- Classes and Properties:
- Defines classes like MenuItem, StrategyMap, Objective, Driver, Constraint, Risk, Action, and SBAR components (Situation, Background, Assessment, Recommendation).
- Properties like causes, inhibits, mitigates, and targetsKPI model relationships between entities.
- Situation (S_Map):
- Describes the current state of the McDonald’s hamburger’s success.
- Causal links show how:
- Availability (store density, hours, drive-thrus) drives access and cultural prominence.
- Speed and taste reliability lead to predictability, which builds trust.
- Trust and ritual/nostalgia foster habit, driving customer choice share.
- Price/value directly influences choice share.
- Background:
- Notes McDonald’s decades-long standardization, global expansion, price discipline, and childhood rituals as foundational to the hamburger’s market position.
- Assessment:
- Drivers: Manipulable factors like availability, speed, predictability, price/deals, taste reliability, and ritual cues.
- Constraints: Real estate/labor costs and the challenge of maintaining baseline brand positioning (avoiding a pivot to “gourmet”).
- Risks: Health perception issues, competition from “better-burger” narratives, and operational inconsistencies.
- Recommendation (R_Map):
- Proposes actions to strengthen the hamburger’s position without chasing premium positioning:
- Protect predictability (process control, training).
- Accelerate drive-thru (queue tools, flow redesign).
- Price signaling (bundles, app deals).
- Refresh ritual cues (kid-friendly facilities, travel convenience).
- Local taste tuning (minor regional tweaks within strict specs).
- Introduces new causal links in the recommendation map:
- Price/value and speed strengthen trust.
- Ritual/nostalgia directly boosts choice share.
- Actions mitigate risks like operational misses and competition.
Summary: The RDF models the McDonald’s hamburger’s enduring appeal as a result of a self-reinforcing cycle: availability and predictability build trust, which fosters habit, amplified by speed, price, ritual, and cultural relevance. The strategy avoids competing with gourmet burgers, instead doubling down on consistency, accessibility, and affordability through targeted actions. The SBAR framework organizes the analysis, with the situation and recommendation maps showing current and proposed causal relationships, respectively.
Why Knowledge Graphs?
At the time of writing, AI is frustratingly flawed. It’s good enough to be dangerous. If it were blatantly bad, we wouldn’t be talking about this now. But it’s good most of the time for most things. So it’s in a sort of uncanny valley of accuracy. Unless you’re an expert at the topic, you wouldn’t know if it was wrong—and if you’re an expert on the topic, you wouldn’t need to ask an LLM questions about that topic.
However, I do have faith that it is much higher than the rate AI is correct (99% to 90%, respectively) that AI quality will continue to trend better and quite quickly. It had better be correct because the premise of my first book, Enterprise Intelligence, and most of the blogs on this site depend on that … haha.
With that impressive performance of ChatGPT and Grok regarding the kahili ginger, why do we need the intermediary SBAR-structured, strategy maps assimilated into an enterprise knowledge graph? Why can’t we just fine-tune the LLM directly with the text-based stories and/or digest it into a vector database of embeddings of chunks of text?
The information held in knowledge graphs is transparent. We can trace its logic. We can see every step, every node and relationship has a name.
On the other hand, LLMs are encoded in a way that we can’t trace their inner workings. It’s pretty much a black box. Meaning, we don’t really know how an LLM came up with a response—we know the process, but we can’t trace the steps like we could with code such as C++, Java, or Python. We know that at the most basic level (it’s more complicated, but for the sake of argument), it’s predicting a sequence of words. But it’s not really possible for us to guess what an LLM is going to say (the process isn’t deterministic).
As we discussed earlier, there is profoundly useful symbiotic relationship between LLMs and KG.
It’s also fine if the outputs are a little off. That subject isn’t going to set off new wars or anything like that. The problem is the “information drifts” as we pass it on, person to person, people to LLM, LLM to people, or LLM to LLM. So periodically, our information and knowledge (the foundation of our wisdom) should be unambiguously refreshed and cast in stone in a form everyone understands. That form is a knowledge graph.
For one, the strategy maps (and other graph structures) were originally created for human consumption. We create these visualizations for presentations and articles because they are effective at helping our audience understand. After all, as we view a landscape for signs of food and danger, we’re analyzing a picture, not text. It’s that “a picture is worth a thousand words” thing.
Let’s contrast the big web of correlations built by Sherlock Holmes and the web of correlations captures in the Tuple Correlation Web discussed earlier to LLMs. The webs of correlations are similar to the very many layers of the Colorado Plateau, where the layers of sediment over hundreds of millions of years preserved information well enough to construct plausible stories of the geological history covering most of Utah, Western Colorado, Northern Arizona, and Northern New Mexico areas.
Note: I’ve spent many vacations over the past twenty years hiking and learning about that area. The layouts of the sediments, the state of the rocks, the fossils, the missing layers —they are all clues lending themselves to abductive reasoning about the history of that huge area.

On the other hand, when material is compiled into an LLM, all sense of individual documents is lost. It’s like an ingredient mixed into a cocktail—just the ghost of its presence is felt. For example, think of olive brine poured into a dirty martini. On its own, olive brine is unmistakably salty and distinctive. But once you pour it into a martini, the brine itself disappears—you no longer taste “olive brine” as a thing. Instead, the drink just carries a hint of salinity and depth. The identity of the ingredient is lost, but its effect permeates the whole.
That’s the same way an LLM digests source material: the “brine” of individual documents dissolves into the mix, leaving only a diffuse influence without a traceable origin.
Although our brains and LLMs are not analogous in structure, they both respond in a highly versatile way compared to computer programs and machine learning models (aside from neural networks) which respond with robotic reliability. The path to the results of brains and LLMs are almost impossible to trace in the same way we monitor the workings of a macro machine like nuclear power plants or F35 jets where can trace to low-level details of the source of problems.
That’s probably the deal with this level of human intelligence. Without direct control of a brain (or LLM), all we can do is influence it. In this manner, it can take decades of therapy to arrive at a reason we react in the way we do to various situations. People are a web of dozens of identified biases, instincts that get them to withhold information or outright lie. People speak in various languages shaped by different cultures and lived unique sets of experiences, so their words often don’t mean exactly what a listener believes he understood.
Our words are abstracted shadows of what is really going on in our heads. Our spoken words are simplified enough where the margin of interpretation error is far less than if we needed to compare neurons and synapses in one brain to another. Of course, the brains interpreting your symbolic information needs to be properly primed with background.
With knowledge graphs, we could build structures that are the rules. We can’t tell an LLM that for this task, this is the only answer. It will say, “Of course …” and do whatever the algorithm tells it to do.
Serializing stories into knowledge graph structures provides both a way to align our intentions and a reality check to see whether what we believe still matches the facts. It’s like the elaborately posed Christmas photo a family takes every year—a meticulously curated snapshot of how they choose to present their story at that moment in time. Taking physical inventory works the same way—no matter how carefully we track what goes in and out, there’s always a long tail of discrepancies where reality slips out of sync with our records.
The Limitations of Knowledge Graphs
Knowledge graphs excel at explicit structure—taxonomies and ontologies that say what a thing is, how it relates, and which rules apply. But some categories are fuzzy by nature. You can specify “cat” with classes and properties (has whiskers, is a mammal, etc.), and still miss the felt pattern of cat-ness that a vision model nails instantly. It’s the classic “I can’t define it perfectly, but I know it when I see it” problem—great for recognition, awkward for definition. Symbolic graphs are brittle at that boundary.
My blog, Embedding Machine Learning Models into Knowledge Graphs, is the remedy: embed small, domain ML models directly in the KG so the graph stays the system of record for meaning and provenance, while models provide the catch-all recognition layer (Fourier for chords, classifiers for species, anomaly scorers for ops, etc.). In practice: make the model a first-class node, link it to the concept it adjudicates, store its confidence as evidence, and let SPARQL pull “facts + verdict + provenance” in one view. The graph remains auditable and composable; the models supply robust pattern detection where hand-crafted definitions fail. That way, cats (and countless other fuzzy categories) are both recognized and explained—recognition by the model, explanation and governance by the graph.
Note: The “I know it when I see it” line comes from Justice Potter Stewart’s 1964 concurrence—useful shorthand for recognition without airtight definition.
LLMs offer a further option when expressing objects or relationships exceed the capabilities of ontologies and taxonomies. They can explain things that defy neat description in ontologies or taxonomies. Continuing with the cat example, even if we could write a large book, it won’t be as effective as a set of images or the pattern-detection of a neural net captures cat-ness more reliably than text alone.
At the same time, there are many concepts that do yield well to words—abstract roles, business rules, historical events—where visual recognition is irrelevant and graphs would become unwieldy. This is where LLMs prove complementary: they can both ground fuzzy categories with examples and articulate the complex, text-based relationships that knowledge graphs often strain to encode. In practice, KGs, ML models, and LLMs each cover a different slice of the landscape—and together they close the gaps left by one another.
Query Efficiency: Knowledge Graphs vs. LLMs
Enterprise-class graph databases like Neo4j and Stardog are engineered for search and query optimization. Once a knowledge graph is deployed, indexes and query planners make it possible to answer complex traversals in milliseconds. Every node and relationship has a name, every query is deterministic, and the cost of each traversal is bounded.
By contrast, an LLM generates its answer from scratch each time you prompt it—it doesn’t “index” past work in the same way. The compute involved in a substantial LLM query can be orders of magnitude higher than the cost of a comparable graph query, since it involves running billions of parameters across layers of a neural net. That difference highlights the complementary fit: KGs excel when you need precise, repeatable queries on structured knowledge, while LLMs shine when you need flexible language-based reasoning over material that defies neat structure.
Conclusion
Our intellect—our ability to think, reason, and create—is built on stories, not just on simpler structures like taxonomies or ontologies. Those taxonomies and ontologies are rich with information, but they don’t move; they don’t breathe. Stories solve problems, or at least patch imperfect information into something plausible. Thinking itself is highly parallel—some puzzles yield in seconds, others take hours, years, or even centuries of accumulated effort.
That’s why I start from the Tuple Correlation Web: a matrix of relationships and scores that can be lifted into chains of strong correlations—the beginnings of stories—hypotheses from which we forge a story. These can then be linked to the goals, objectives, and feelings captured in a strategy map. Each KPI node is tied by correlation scores, turning abstract data into something more like narrative.
Here is an anecdote helps make the point. Bird songs are simple, but they work as sequential stories: a note is sung, it’s heard back, that hearing triggers the next note, and on it goes. On and on it goes, a small vocabulary with room for error but still enough to sustain a dialogue. Studies of duetting wrens show precisely this hear-→recognize-→respond loop, where sensory input from one bird triggers timed output in its partner. And in species like canaries, researchers have found long-range order in birdsong, meaning later notes depend on much earlier ones—evidence of learned sequence rules. Together these findings suggest that iterative recognition-driven sequences can scaffold complex, story-like structure.
It’s worth remembering that storytelling sits on top of our older, more basic survival intelligence—what I’ve colloquially called reptile intelligence (really the fast, subcortical survival circuits underneath the reflective layer). Stories is the higher layer, the foundation of our sentience, organized experience crafted into narratives that can be remembered, shared, and extended.
Of course, this is an analogy. Analogies always break somewhere. But they’re useful scaffolding—a footing we can build on. The point isn’t that bird duets are human stories, or that every correlation chain is a narrative. The point is that our intelligence seems to arise from weaving sequences of recognition into coherent arcs. And that, more than anything else, is why stories are fundamental.
Context Engineering: Crafting the Narrative Framework for AI Understanding
Context engineering is a newly emerged term in AI. It’s the systematic design of the entire environment an AI works inside—what information is retrieved and trusted, how it’s chunked, ranked, formatted, and sequenced; what memory is persisted, and which tools the model can call—so it reliably achieves a task over many turns. It complements prompt engineering (the instruction text) by supplying the right evidence at the right time (RAG), maintaining session and long-term state, enforcing output contracts (ex. JSON schemas), and grounding answers to reduce drift and hallucinations.
In the framing of this blog, stories in an SBAR format are a powerful format of context.
In a future blog, I’ll discuss how my book, Enterprise Intelligence, supports this newly emerged notion of Context Engineering. For now, my blog, Embedding a Data Vault in a Data Mesh – Part 1 of 5, describes this one-two punch approach as the most effective way to accelerate the onboarding of the data across what could be hundreds of domains across an enterprise. That integration of data across the far reaches of the enterprise is the first step.
