
Introduction
The main takeaway of this blog is an explanation of how my two books, Enterprise Intelligence (June 21, 2024) and the more recently published Time Molecules (June 4, 2025), connect. Time Molecules is a follow-up to my first book, Enterprise Intelligence. It connects by expanding upon a BI knowledge structure introduced in Enterprise Intelligence—the “Tuple Correlation Web”.
However, I wrote Time Molecules to stand independent from Enterprise Intelligence. That way, reading Enterprise Intelligence wouldn’t be a hefty prerequisite for Time Molecules. I do explain this link between the two books in Time Molecules, but I need to explain this without your needing to read it first to find out you don’t need to read Enterprise Intelligence first, and that Time Molecules isn’t a book on some strange physics.
The end-product of Enterprise Intelligence is a knowledge graph extended with a few specialized, scalable, and powerful knowledge structures, which yields the Enterprise Knowledge Graph (EKG). The end-product of Time Molecules is a “process-oriented data warehouse” from which we can generate light-compute, time-based models, particularly Markov models. Connecting these two end-products produces a knowledge graph of the detection of things/concepts as well as processes/systems—think of it as a Business Intelligence version of space-time.
This is a hefty blog, so here is the TL;DR of this blog:
- The Tuple Correlation Web of Enterprise Intelligence linking to the Markov models of Time Molecules forms an even more powerful web of Hidden Markov models. Skip over to the topic, The Enterprise Knowledge Graph, which is towards the end of this blog—it’s just one figure and some explanation.
- Enterprise Intelligence captures insights from traditional BI which is the analytical side of operational software systems (ex. CRM, SCM, ERP). Time Molecules is the “BI side of Process Mining and Systems Thinking”.
- Compare the dimensional, tuple-based OLAP, which optimizes the ubiquitous slice and dice querying of transactions we’ve known and loved for a quarter century to optimizing the analysis of event-based processes.
- Traditional OLAP is tuple-based, Time Molecules is case-based (cases group events).
- BI OLAP cubes dramatically improve query performance and cost by caching expensive compute through aggregations by tuple sets (think of it like a dataframe), and Time Molecules caches by compressing process events into Markov models. Both are about O(n) in computation, so on the fly aggregation/compression is a feasible option.
What is the value of that extended knowledge graph? In this time of rapidly evolving AI and robotics, I offer my thoughts on taking a few steps back to look at this from my perspective founded on my own attempts at cracking this nut since the 2004 (but really since the 1980s). Since I began my programming career in 1979, I’ve been through three to five AI hype cycles (depending on how you count them) and plowing through the subsequent AI winters—which means I’ve approached this from multiple angles.
In all that time, I’ve never had a position as any sort of “researcher”. Rather, I was always part of a software implementation team—specializing in business intelligence systems since 1998, more broadly, a software developer since 1979. But I’ve always had a powerful hunger to explore what the customer didn’t ask for. Therefore, my “AI” efforts have always been in the context of attempting to solve the cutting or bleeding edge “stretch goals” of my customers, applying techniques that were still considered outside of the mainstream IT consciousness. I believe my efforts as an application programmer across multiple AI hype cycles provides a sober view towards AI.
Each AI hype cycle comes with the feeling that “this time is different”—usually accompanied by some grand vision of utopia or apocalypse. But like the Gartner Hype Cycle suggests, the actual impact doesn’t land in the boom or the bust. It shows up during the slow, evolutionary grind of the so-called Plateau of Productivity. That’s where progress hides—infrastructure gets built, workflows change, and minds slowly adapt.
Things are different this time. The current primary AI technology, LLMs, may not by themselves achieve AGI or ASI, but they are “good enough” to be of substantial value to billions of people. However, LLMs could lull the general population into intellectual complacency, as LLMs are also smart enough and unempathetic enough to be dangerous.
It’s like the early automobile. The first cars were unreliable, slow, and sometimes still outperformed by horses. But they were just good enough to be a catalyst that drastically changed the world (for better or worse). Roads got paved. Cities restructured around gas stations, traffic lights, and drive-thrus. Everything from how we shop to how we fight wars adjusted to make space for a mediocre machine with outsized potential.
Today’s AI feels a like that. It hallucinates, loses track of the conversation, and it can’t reason like we hoped—but it’s already reshaping human expectations and how everyone accesses information across the Internet. In the simplest use case, it’s many times better than the old keyword-based Web searches. That’s enough to start changing the terrain, whether or not it’s the final form.
To explain the value of the Enterprise Knowledge Graph I describe in the books, we’ll take an SBAR journey:
- Situation: What is the clear and present problem being addressed—that is the disruption that artificial intelligence crashing the party of our human intelligence has and is growingly continuing to cause.
- Background: How did this problem happen? Applying AI into our current analytics systems, all while AI is evolving in rapid and unpredictable ways. That is, applying AI on top of a solid and existing BI solution.
- Analysis: What do we have to work with and what are the options? AI today is good enough to remove much friction that has held back BI efforts. That is, how to integrate all data sources.
- Recommendation: What do we propose? Create an Enterprise Knowledge Graph …
- Which is grounded by a Semantic, ontology-based knowledge graph representing the human side of how the world is intended to be perceived and to work,
- That is linked semantically to an enterprise-wide data catalog mapping all the available data sources,
- Is extended with structures automatically derived from BI consumer activity,
- And embraces event processing as a source of first class objects from what could be billions of IoT devices and AI agents.
You could skip the Situation, Background, and some of the Analysis parts, over to High Query Performance of BI, then flip back if needed.
Quick Book Notes
- Time Molecules and Enterprise Intelligence are available on Amazon and Technics Publications. If you purchase either book (Time Molecules, Enterprise Intelligence) from the Technic Publication site, use the coupon code TP25 for a 25% discount off most items.
- For light overviews of the books:
- Time Molecules: Sneak Peek at my New Book – Time Molecules.
- Enterprise Intelligence: TL;DR of Enterprise Intelligence and Enterprise Intelligence (Book) FAQ
Situation: All that AI Disruption and Chaos
When will there be AGI or ASI? What will be left for people to do as AI improves? What are the AI plays for investment? Is AI mostly marketing hype? Can we trust AI? How should we regulate it?
I just don’t know—because the situation is unprecedented, it’s about intelligence itself (the most mysterious subject), there are too many moving parts, and too many highly-vested parties. So logically, everyone is just taking guesses. And I know that even if AI progresses to powerful Vaal, Landru, and/or “1984 “status, I’m still me, and it won’t be a world I like.
With that said, we can try to put a stop to it (that opens a big Pandora’s box of problems itself), go all-in (because if we don’t do it, our competitors will), or find a middle way. My two books describe a middle way, a hedge on the bets we could place on where we’re headed with AI. It’s a conservative approach that builds on top of the foundation of our traditional IT disciplines we’ve been honing for decades. This middle way also leaves the door open for maximum warp speed if or when it’s needed.
In a nutshell, we build an infrastructure for developing and maintaining an extended knowledge graph, an organization of enterprise-wide knowledge, as self-maintaining as possible. AI plays the role of a fantastically versatile mortar/glue between the pieces—as versatile as Duct Tape.
AI today is good enough to fool most people—that is, pass the Turing Test as I believe Alan Turing meant, not the evolving “moving the goal post” definition. The reason why it may not seem that the AI of today passes the Turing Test is because we now know we’re talking to an AI and that it can easily fool us—similar to “once we see it, we can’t unsee it”. So right now, AI may not be able to replace the top geniuses of our time, but as I mentioned, it’s “good enough” to assist us (albeit also just “smart enough to be dangerous”)—at scale, relatively inexpensive (depending on how you look at it), and with wonderous versatility.
Figure 1 is a modified Gartner Hype Cycle. The black line represents the typical path. But this round of AI is far from typical. I imagine we’d like to avoid “The Borg” or “The Matrix” outcomes (Shot of Lost Control) as well as the SkyNet outcome (Cliff of Crash & Burn).
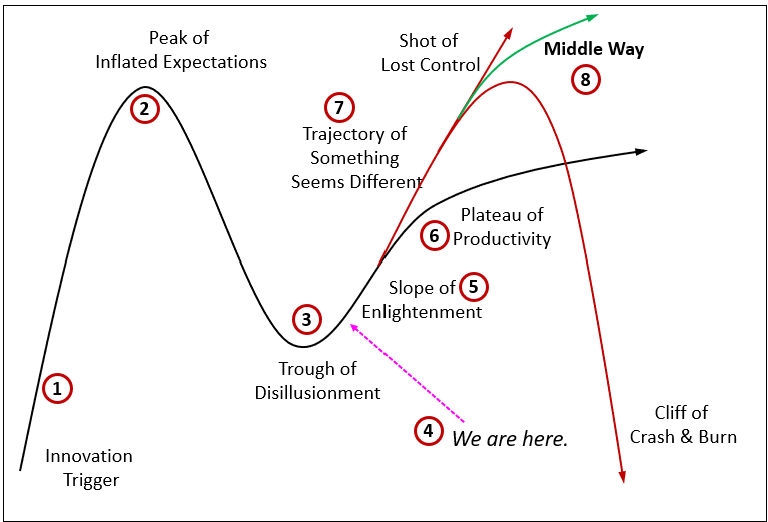
Here are the descriptions:
- Innovation Trigger: This begins the very famous Gartner Hype Cycle. The innovation trigger for this AI Era of the LLM is the release of ChatGPT 3.5 readily available to the general public on November 30, 2022.
- Peak of Inflated Expectations: I think this happened quite quickly. The notion of hallucinations and the need for prompt engineering, fine-tuning, and embedding LLMs in processes such as Chain of Thought and RAG were very evident only a few months later. However, it took at least a year before the real slide to the Trough of Disillusionment—the realization that larger LLMs would continue to provide significant performance gains.
- Trough of Disillusionment: The big wave of AI enthusiasts are about to hit here.
- We are Here: The early adopters already rounded the trough of disillusionment.
- Slope of Enlightenment: Here, there is an understanding that intelligence is more than a simple model. The world is complex, rife with imperfect information. Early adopters have already begun mixing in symbolic structures such as knowledge graphs and rules engines.
- Plateau of Productivity: It’s really a slight evolutionary incline, usually eventually reaching back up towards the Peak of Inflated Expectations, perhaps even beyond. This is where the Gartner Hype Cycle normally goes. We don’t reach the peak of inflated expectation quickly. Instead, it’s a long evolutionary road back there. However, this round of AI isn’t the typical subject of a hype cycle.
- Trajectory of Something Seems Different: This round isn’t likely to just slowly meld into society like PCs, the Internet, and smart phones over the source of a couple of decades along the evolutionary Plateau of Productivity. It’s a revolutionary (which is good for some, bad for others), not evolutionary path. AI could get out of the control of the masses (Shot of Lost Control) or it could be what destroys us (Cliff of Crash and Burn).
- Middle Way: This is about building trust over a long period of time—letting a disruption slowly evolve, properly socialize, into our world. The middle way has a steeper trajectory than the Plateau (slight incline) of [evolutionary] Productivity. But it still leans on the side of evolutionary. An evolutionary path gives the surroundings a chance to comfortably morph itself.
The Middle Way encourages that:
- AI is only ever in an assistant role, never in a management role.
- The scope of each agent should be fairly narrow—not as narrow as the usual type of machine learning model such as one to detect credit card fraud, but not across a wide breadth. While AI’s “intelligence” is derived from a massively diverse training set (it knows a lot about a lot of things), it’s scope of responsibility should be narrow. Whether an AI object is an assistant or agent shouldn’t be binary.
- Like any relationship, it takes time to prove and build trust. We need to take the necessary time to get to know it.
I know how dull that might sound amid the excitement and glamour of trillions of dollars at stake, the existential threat to humanity or utopia, and what will end up as the Amazon, Google, and Facebook of this cycle. One might even say it’s such a “boomer” view (I’m a boomer, so I can say that). But with insane complexity driven through eight billion people connected through the Internet, all with minds of their own (at least I like to think so) nothing with such massive consequences can be pursued so recklessly. The exception being when a meteor as big as Oahu is coming at us with 1.0 probability. Then we go all-in. Otherwise, a bad outcome is an unforced error.
One more note about item 6 of Figure 1. The “Plateau of Creativity”, perhaps better called the “Incline of Evolution”, doesn’t mean it remains that way forever. That’s as silly as a hockey stick curve rocketing upwards forever. We might forget that if we look at that iconic image of the Gartner Hype Cycle. Chances are there will be inflection points as we move through time—inflection points can happen a few years from now, decades, perhaps longer. There will be something else that emerges, mixing in, accentuating each other. As LLMs accentuate knowledge graphs today, other components of intelligence will pop. LLMs are great, but chances are intelligence isn’t just about LLMs.
Pidgin For Human Intelligence and Machine Intelligence
Computers burst onto our world in what is getting close to a century ago, and we’ve been stumbling to communicate with them ever since—from wiring vacuum tubes to punch cards, from text UIs to GUIs, to the Internet and Web 1.0, 2.0, and 3.0, and now to “good enough” AI that’s genuinely approaching sentience.
The notion of the AI of today (particularly AI agents) breaches the boundary of mere tools that extend our human capabilities. The arrival of AI that can pass the Turing Test for the vast majority of people represents an abrupt collision of “cultures”, and we need to learn to work with them quickly. Just as the phenomenon of emerging “pidgin” bridged the gaps between many native tongues throughout history, we need a develop that pidgin—one that lets millions of human experts and ever-smarter AIs ask questions of each other and share answers without endless translation or misunderstanding—that will evolve into a “creole”.
The “pidgin” of Hawaii, which is really now a “creole“, is close to my heart. I grew up in a small town in Hawaii called Wahiawa where my family has been since the late 1800s. Wahiawa was once billed as the “Pineapple Capital of the World,” where the pineapple and sugar cane fields drew workers from all over the world to work along with the native Hawaiians—Japan, the Philippines, Portugal, China, Korea, Puerto Rico … In fact, it’s the basis for the book cover of Enterprise Intelligence.
Among the many people from different cultures—who were abruptly thrown together as we’ve been abruptly thrown together with AI—were as many different spoken languages, making communication between them tedious at best. I’m sure at first communication was like playing charades. But they somehow needed to communicate towards successfully completely the work that needed to be done.
Soon enough, they’d learn a few important words—hello, good-bye, thank you, hungry, etc. Joss like when we veezit one country whey-ah we no talk da language —kau kau, lo siento, sumimasen, …
Eventually, the foundation for communication emerged—built on top of English (since the English speakers were the ones who brought them there). But it was heavily interspersed with words, idioms, and phrases from English, Hawaiian, and the languages of those newer arrivals.
The pidgin was good enough so everyone could effectively work together—at least for the field work that was very laborious, but not very intellectually complicated. Over the years, the pidgin evolved a syntax of its own. It’s not proper English, but the sentences are constructed in a fairly consistent manner. At this point, it should be called a “Creole”, baht tu deese day eet steel “Peedjin”. (Translation: Although Hawaiian Pidgin is technically a creole, it’s still referred to as “Pidgin’.)
Background: Map Rock – Version 2.0 Attempt at Integrating Machine Intelligence and Human Intelligence.
To provide background for how I’m approaching the situation today, I’d like to introduce my work that took place from 2004 through about 2016. What’s interesting is that although my approach towards implementing AI today is fairly much the same as it was in that timeframe, the problem I’m trying to solve is different.
My goal back in 2004-2016 was to build an AI. My approach was a mixture of:
- Knowledge graphs: The end product was based on a comprehensive knowledge graph (KG)—similar to what we have today in Wikidata and Google Knowledge Graph. But it would include structures beyond ontologies and taxonomies. It would be an enterprise knowledge graph.
- The symbolic and logical encoding of Prolog.
- The rules-generation of machine learning.
Back then, there wasn’t an AI like ChatGPT or Grok that requires hardly any skill to use (it could be as simple as using it in the same way you’ve been performing Web searches the past 30 years) and can address almost any problem to at least a fair level of competence. It knows most things about most things and can reason modestly well. But modestly good reasoning doesn’t solve novel and/or complex problems.
Today, with current LLMs (the first time I think we have something worthy of the term “AI”), the problem I wish to solve are the competing goals of:
- Avoiding a terribly dystopian outcome with AI,
- While reaping its immense benefits,
- Not falling behind in terms of AI capability to whatever we might perceive as “the enemy”.
That’s our 21st century version of, “You can have it cheap, fast, good—pick two.” Somehow, though, we need all three.
The toughest part is not only developing such a graph but maintaining it. I painfully learned how difficult it is to manually author and maintain even a modest knowledge graph, so these extended parts needed to be self-assembled to the largest extent possible.
For those building knowledge graphs that include business rules, the big problem is, “Where do the rules come from?” There wasn’t and still isn’t an AI capable of reliably creating high-quality rules and keeping them up to date.
Data Science as the Source of Rules
Self-organizing knowledge was too much to tackle as a “stretch goal” project for my customers pre-2015. But as a BI developer I was aware of an emerging distributed system that could help build this extended KG. That distributed system was the rapidly growing area of “data science” (formerly data mining, predictive analytics, etc.)—multiple data science teams building machine learning models applied to a variety of decision-making tasks such as detecting credit card fraud. These data scientists were downstream from my data engineering/architecture role—they were a new class of data consumers in addition to my typical BI analysts and managers.
The big idea was to take the many machine learning models the data scientists develop and maintain, convert the rules to Prolog and embed the Prolog as nodes into the KG. Back then, the hope was that the machine learning models were deployed using a common syntax called PMML (predictive model markup language). That way, I needed just one C# app to convert from PMML to Prolog. Aside from neural networks, most other machine learning models are really a set of rules derived from a data set—perfect for Prolog.
This way, the Prolog generated from the distributed development and maintenance of machine learning models could be combined with Prolog by other methods—which essentially meant “manually” back then. Today, LLMs are capable of generating rules from machine learning models into Prolog from formats such as “pickle files” (after extracting it from its binary format) and still PMML.
However, this was before the June 2018 introduction of MLflow and well before the November 2022 release of ChatGPT 3.5. I did write “Custom Tasks” (an SSIS task of customer-written C#) to implement this. But back well before 2015, this was all too much for my customers …
The Chasm between Human Intelligence and Machine Intelligence
Figure 2 is an old slide of mine I haven’t seen since 2015. It’s from a Map Rock presentation (sorry for the ca. 2010s dark background and how busy it is—click on it to see it in full form) illustrating the big chasm between human intelligence and machine intelligence that can be reduced through an intermediary pidgin.
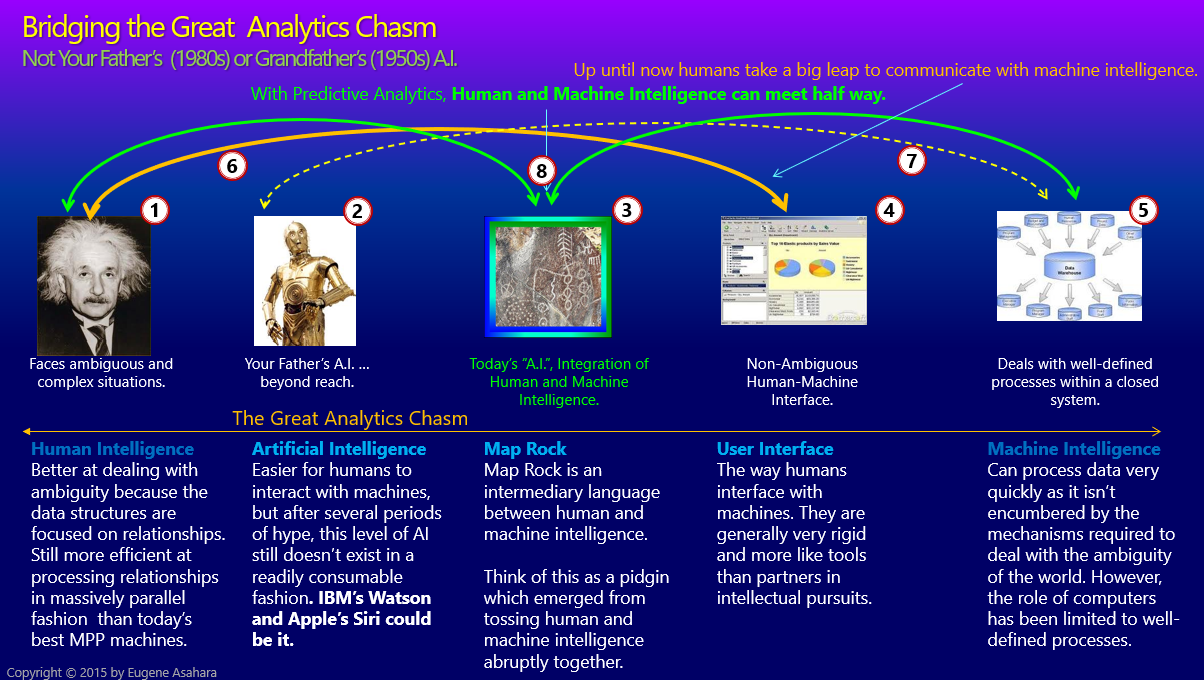
Here is the explanation of the numbered items:
- On the left is Einstein, representing human intelligence.
- C3PO stands in as a human-like entity is sort of like the GUI (4) equivalent. This level of AI doesn’t yet exist, but LLMs are good leap forward since 2015. Notice my dated comment about Siri and Watson …
- This is Map Rock, a semi-autonomously built extended KG.
- A GUI dashboard that is the interface through which the user talks to machine intelligence.
- Machine intelligence of data, algorithms, and models..
- The orange line from Einstein to the dashboard represents how we communicate with machine intelligence through some sort of interface. It’s rather clumsy and doesn’t reflect the fullness of the machine intelligence—in the same way a single person can’t reflect the entire knowledge of humanity.
- The dashed yellow line represents the ideal way for machine intelligence to communicate with humans intelligence.
- These green lines point to Map Rock, the pidgin where human intelligence and machine intelligence can meet halfway.
2015 was a long time ago. Why didn’t anything become of this? Well, back then there wasn’t AI as we know it today. The presentation was about creating a knowledge graph extended to include BI-derived information and embedded machine learning models (sometimes lumped in with AI). The presentation was delivered at a MeetUp of the “Boise BI User Group” (hosted by the Boise Microsoft office) on October 8, 2015, titled, “The Immense Potential for Large Scale Graphs in a Business Intelligence Environment“.
BTW, SCL (Soft-Coded Logic), a Prolog variant I wrote back in 2004-2005 was Version 1.0. The blog series, Prolog in the LLM Era, expands on this.
Analysis: Map Rock in a World with a Good Enough AI
To begin analysis of how to solve the problem, it’s interesting to note that the main missing ingredient is also the cause of the problem. AI is good enough to be a mortar that can glue the components together. It can be applied in a framework that is a balance of narrow scope and required versatility.
I spent the entire holiday season of 2022 testing out ChatGPT 3.5. Was this the good enough AI I needed to make the concepts of Map Rock feasible, to not be such a pain to semi-assemble? I tried quite a few experiments, but there were two major ones.
One of those experiments had to do with Master Data Management (MDM). It’s a problem that has reasonably good solutions today, but master data is a pain to maintain at large scale (thousands to millions of individuals of a class and/or many classes), and it still makes quite a few mistakes. When we’re dealing with tens of thousands to millions of customers, there will be mistakes and the result will be awkward at best.
I tried an experiment, feeding ChatGPT 3.5 chunks of pairs of customers (from different databases) and selected properties from an MDM test file (completely anonymized and adequately obfuscated) and asked it to rate the similarity between them. If I recall, the token window (the maximum number of recent tokens a model can “see” and use when generating its next output) was such that it could only handle about a dozen at a time. Although the similarity scores weren’t perfect, it was substantially superior in terms of time and quality to any MDM system I tested that file on over the years.
I then tested ChatGPT 3.5 on something tougher: Help me write a knowledge graph of SQL Server internals (mapping metrics, configurations, parameters, events logs, and traces). I did this back in 2005 and it took me months to complete something that was somewhat useful. I didn’t complete the exercise partnering with ChatGPT 3.5, but I did enough where I believe it would have brought down the development time to weeks—roughly a magnitude of improvement.
These two exercises (and a few others) back in December 2022, was an experiment with ChatGPT 3.5 as my assistant on “production” projects. It resulted in substantial, game-changing, and mind-bogglingly inexpensive performance improvement. And that is, without going all “SkyNet” on me or saying some wild stuff at a press conference. It was good enough to act as glue piecing together the big pieces of an analytics platform. That “glue” is more than the middleware, APIs, and protocols that have been brittle pains over the decades.
Over the next six months, I collected notes and material from projects mostly in the 2004-2016 period, recalled the problems I ran into, experimented, and compiled the material for Enterprise Intelligence and Time Molecules.
As I write this post on July 10, 2025, I’m certain about two things:
- Barring some self-inflicted catastrophe, AGI—or even ASI—is inevitable. The only real uncertainty is when. I believe the probability distribution is fairly even across the next fifty years, with a slight skew toward the near term—perhaps around 2030—but the truth is, we just don’t know. Remember too, the meaning for AGI itself is far from clear.
- Nobody knows how the AI journey will play out. There are many good guesses. But I don’t trust much of what the experts say because there’s too much at stake and so we’re all a little whacky right now: fear of being left behind, being replaced by a robot, ungodly sums of money and amassing power, the Skynet risk, and all that stuff.
Before ChatGPT’s burst onto the public scene back in November 2022, I would have said there was at least five more years before we really needed to begin worrying about AI at the level we have today. When I began playing with ChatGPT 3.5, it was immediately fascinatingly fun and entertaining, but it disappointingly fell apart as I pushed it with questions that are beyond current conventional thought—it ranged from providing me with expert-level but well-known (not good at “outside the box” thinking) information to the famous hallucinations.
It’s not a good partner for bouncing ideas from novel and/or complex points of view. Even today, it’s of no practical use for the many substantial and unresolved questions and problems I’ve thought about over my life. It just feeds me an amalgam of textbook answers I can get from resources available to anyone.
AI Applied on Top of a Solid BI Foundation
BI systems are the products of decades of honing the art and craft of developing a trusted data source upon which we can make informed decisions. Data quality, compliance, security, query performance, cost, user-friendliness, and comprehensiveness have all been hammered and honed in BI software and methodologies over the past few decades—and none of that goes out of style just because AI comes along.

BI is about measurement. An OLAP cube, a primary form of BI data, is a multi-dimensional database of measures. BI itself isn’t about prediction, intent, and decision making—but that’s all built on top of the trustworthy and user-friendly foundation of BI. I don’t need to say, “Garbage In – Garbage Out” or “measure twice, cut once”, and all that other stuff.
In the context of BI, user-friendliness goes a long way towards mitigating garbage-out:
- It’s easy to find the data. It’s well-organized (integrated dimensional model), everything is labeled in a consistent and jargonless way.
- Queries are fast, at the speed of thought. Derailment of thought is minimized.
- Query results can be rendered in different ways for different purposes.
AI could be an interpreter between human BI consumers and the databases, and it could also be a BI consumer itself (part of a RAG process or as an AI agent). So BI is a great foundation upon which to apply AI.
I’d like to discuss two difficult qualities of BI that are of primary relevance to the two books. First, Onboading of Data Sources, then a few topics later, High Query Performance of BI.
Rapid Onboarding of New Data Sources to the BI Platform
The big and persistent problem of BI has always been mapping entities across enterprise domains. Domains across enterprises have their own databases, domain jargon, and context, so each requires some level of autonomy (let them do their jobs without stifling them with rules). But, computers need things to be exact, so in order to integrate data across domains, translation is required. For example, Eugene Asahara, the customer of the sales database, is recognized as “Eugene A. Asahara”, the lead from the marketing database. Or, “Blue Cross/Blue Shield” is BCBS, or customers and patients are the same thing.
The onboarding of BI sources is necessary to provide the connections to the far reaches of an enterprise, and beyond the enterprise to external data about customers, vendors, agencies, etc. It was OK to begin this integrating the important databases, such as from ERP, SCM, CRM. But making decisions goes beyond cleansed, easily accessible, and highly performant—the things BI has done well for years. Intelligence requires the incorporation of thousands of “senses”. The human analogy was if we only depended on sight and sound, and not the thousands of other senses we really have.
The topic of data integration is relevant because it involves two main characters of this blog: The merely “good enough” level of today’s AI and the vast expansion of data source that includes the proliferation of millions to billions of IoT devices and upcoming swarms of AI agents (which we could think of as “smart” IoT devices).
Following are the major efforts at BI data integration over the past few decades. I list them because they are all rather unique, adding another dimension to the effort. None have made another obsolete. It’s worth noting that similarly, most of the past efforts at AI are also not obsolete in this era of LLMs: rule-based coding, semantic web, machine learning, deep learning. They are legitimate facets of a solution.
Bus Matrix
Kimball’s Bus Matrix is the OG of integrating data sources. It uses a simple grid of “conformed dimensions” versus fact tables to enforce consistent definitions across subject areas and streamline reporting. But as enterprises absorb IoT feeds, third-party APIs, and diverse data streams, dimension divergence, semantic overload, mismatched hierarchies, and the constant need to update the matrix expose its rigidity. Its reliance on a central governance team creates bottlenecks and backlogs, slowing new source onboarding.
Master Data Management – Greatly enhanced by AI
Master Data Management (MDM) is about creating a single, authoritative record of core entities—customers, products, suppliers—so every system speaks the same language. AI today accelerates entity matching by suggesting links across domains and highlighting probable duplicates, but those suggestions still demand careful human review to validate definitions and catch subtle exceptions.
At scale, getting data stewards from different teams to agree on what truly belongs in “Customer” or “Product” slows progress, and in some cases no amount of matching can reconcile fundamentally mismatched structures—forcing square pegs into round holes. The result remains a labor-intensive, governance-heavy process, even with AI assistance.
Extract, Load, Transform (ELT)
ELT flips the L and the T of traditional ETL, the traditional workflow by loading raw data into a central repository first and deferring all transformations—mapping, cleansing, enrichment—to downstream processes or end-users. In theory, this decentralizes work: domain experts and analysts apply the mappings they need in their own queries or analytics tools, often using SQL or notebook environments, and can iterate quickly as requirements evolve.
In practice, however, it shifts the heavy lifting of entity mapping from a small BI team to a broad (and often under-governed) user base. Without centralized standards or reusable pipelines, you end up with a forest of one-off transformations—each analyst reinventing customer, product, or location mappings to suit their own reports—leading to inconsistent definitions, duplicated effort, and a lack of trust in “the single source of truth.”
Data Vault
Data Vault shifts the focus from rigid mapping to flexible integration by abstracting new domains into “hubs” (core entities) and linking descriptive details in “satellites.” This makes onboarding fresh sources fast—each new system simply pushes its entity records into the appropriate hub and its attributes into a satellite—without blocking on perfect cross-domain alignment. Analysts gain access to a raw, historical data lake that preserves every change, but because it isn’t pre-packaged for reporting, they must still transform vault data into business-friendly models.
And while Data Vault eases ingestion, it doesn’t eliminate the need for MDM or any other sort of data source integration method. Data stewards still must reconcile definitions and govern hubs to prevent proliferation of near-duplicate entities. To me, data vault and ELT (not ETL) are similar in that both punt the transformations downstream.
Data Mesh
Data Mesh decentralizes ownership by treating each domain (e.g., Sales, Inventory, Finance) as the steward of its own data products, complete with clearly defined schemas, SLAs, and discoverable interfaces. This domain-oriented approach relieves the central BI team from being a bottleneck and brings mapping closer to the source experts whose context is richest.
However, because each domain independently models entities like “Customer” or “Product,” you often end up with subtly different definitions and field structures that complicate cross-domain joins. Inconsistent naming conventions, varying levels of granularity, and divergent governance practices can lead to semantic drift, duplicated transformation logic, and fragile interoperability—meaning consumers still spend significant effort harmonizing data before they trust it.
A few years ago I wrote about how a Data Vault could be the ideal data warehouse structure for an enterprise-wide data mesh effort: Embedding a Data Vault in a Data Mesh – Part 1 of 5
Event Processing (Time Molecules)
A dimensional data warehouse (Kimball) or EDW from which Dimensional Data Marts are derived (Inmon) is the traditional database model of BI (data warehouses and data marts, ETL, OLAP cubes, visualization tools). However, Time Molecules adds the process-focused perspective by treating every data point as a timestamped event—each record distilled down to a CaseID, EventName, and DateTime. By using time as the universal key, you can build massive Markov-style transition graphs (Time Molecules) or correlation webs across disparate domains without first wrestling with rigid entity mappings.
This approach excels at capturing process variations—IoT sensor readings, user clicks, transactional logs—into a single event stream where pattern discovery and conditional probabilities emerge naturally. However, it also introduces new challenges: defining a consistent CaseID often means reverse-engineering business workflows across systems; normalizing event vocabularies requires upfront ontological work (you still need to agree that “Login” in one system equals “SignIn” in another); clock skew and missing timestamps can distort sequences; and the sheer volume of events demands scalable storage and indexing.
In practice, without careful schema governance, event streams can become yet another siloed pipeline—full of raw facts but lacking the semantic alignment needed for reliable, enterprise-wide insights.
The Two Books
This post could be thought of as a re-launch of both books—but this time as a greater whole. Together, the books describe how to build the data structure, an extended KG, that captures an expansive, albeit shallow, sense of what is happening in the enterprise.
I think of this from a first principle that a seemingly viable complex system is composed from simple rules. Thus, I generalize information to insights and correlations of Enterprise Intelligence and processes/systems of Time Molecules. These are three KG structures introduced in the two books that we will explore and that ultimately link together: Insight Space Graph, Tuple Correlation Web, and Time Molecules.
Enterprise Intelligence: Bridging the Gaps between Wisdom, Business Intelligence, Knowledge Graphs, and Artificial Intelligence
The primary goal of Enterprise Intelligence is to describe how some of the big former “next big things” in the enterprise data space over the past couple of decades fits together. This is described in my blog (which is somewhat close to full title of the book as well), Enterprise Intelligence: Integrating BI, Data Mesh, Knowledge Graphs, Knowledge Workers, and Artificial Intelligence.

Even though the seemingly surprising performance of Grok 4 (released July 11, 2025) is impressive and a good-sized leap, I don’t think it makes what I suggest in this blog and the books moot. Rather better AI will do an even better job at building what is shown in Figure 3. … until AI becomes too good.
The pieces listed in the subtitle of Enterprise Intelligence (and there are a few others), never had sufficient time to fully assimilate into the enterprise. Each fairly quickly reached Gartner’s “Trough of Disillusionment”—in large part because it wasn’t a single, magical, silver bullet. But by the grace of Silicon Valley, by time it matured enough to move beyond the early adapter audience, there was a new big thing. And that new big thing often came with the same great hope, as the messiah of analytics, solving all of the analytics world’s problems.
A good metaphor is that there are many ways to get into a house—you just keep trying a different door, window, or chimney, until you find one that can get you in. In a sense, the promise of AI for this AI cycle is that we can just smash in a window. But that triggers the alarms …
However, those components weren’t really the great hope, nor is it a ploy to just sell customers into another hype cycle. Many are a legitimate, major component of an analytics platform that is fully capable of supporting the intelligence of a business. Similarly, as I write this in July 2025, my feeling is that LLMs have rounded “The Peak of Inflated Expectations” well on their way to “The Trough of Disillusionment”. The thing is, although I believe it to be true that LLMs alone will not get us to AGI/ASI, it’s a major component of a fully-fledged AI. So as expert systems, knowledge graphs, business intelligence, performance management, master data management, deep learning, data science, big data, data lakes, data virtualization, data fabric, data mesh, etc, didn’t end with analytics nirvana, each is a definite component.
So LLMs with all their errors and hallucinations didn’t create analytics nirvana—the world where every day is the “Groundhog Day” version of your birthday at Disneyland. But they are good enough to be a marvelous enabler of what I describe in Enterprise Intelligence,
Insight Space Graph
One of the problems with BI (until this current LLM era of AI) is that the information it yielded mostly ended with the human BI analyst pulling up charts, graphs, and dashboards through visualization tools such as Excel, Cognos, Tableau, and Power BI. Then like all lives, it returns to the dust from which it came.
That information was the result of a conscious effort. Whenever a BI analyst pulls up some visualization, they are purposefully looking for information. The particular data they request using a particular visualization might show them what they are looking for. In that event, that information is incorporated into some decision or some sort of communication to someone else.
Along the analytical journey the information might be presented, but it isn’t of interest to the particular analyst. Every visualization has:
- Information the analyst sees that is readily relevant to the analyst.
- Information the analyst sees that doesn’t appear to be relevant to the analyst, but could be important to someone else. But it might be to someone else in some remote part of the enterprise they might not even be aware of.
- Information visible in the visualization, but they don’t see it, in a “Where’s Waldo” kind of way.
In any case, whatever analysts typically look for in a bar chart, line graph, etc., is easily capturable in simple code of light computation. It can be captured in the ISG for some adjustable length of time, available to any other analyst (of course, with the proper security), human or AI agent.
The big idea of the ISG is to programmatically capture the insights across all visualization types derived from queries issued by human analysts. The insights are stored in a central database for some determined period of time. This way, insights not useful for some analyst might be useful to another.
Here are a few blogs that further describe the ISG:
- Knowledge Graph BI Component: Insight Space Graph
- Insight Space Graph
- Charting the Insight Space of Enterprise Data
Tuples
Before continuing to the Tuple Correlation Web overview, I’d like to talk about tuples (too-pulls). They are the result of those ubiquitous slice and dices queries of analytics.
Tuples, in the BI sense, are specifically qualified metrics. Loosely, every subject-verb-object phrase spoken in natural language could be re-written as a tuple. For example, “Eugene bought a $30 pizza from the Guido’s in Garden City this past Monday”, could form a tuple:
(Person=Eugene, Food=Pizza, Date=2025-07-07, Restaurant=Guido’s, Location=Garden City, Cost=$30)
Another example: “Laurie made taco salad for $5 today”, could form the tuple:
(Person=Laurie, Food=Taco Salad, Date=2025-07-11, Restaurant=Laurie, Location=Boise, Cost=$5)
Note that the position of the elements are the same. In fact, the two tuples, which comprise a “tuple set”, could be formatted as a regular old ledger table as shown in Table 1. The cost column is a measure and the others are dimensions.
| Person | Food | Date | Restaurant | Location | Cost |
|---|---|---|---|---|---|
| Eugene | Pizza | 2025-07-07 | Guido’s | Garden City | $30 |
| Laurie | Taco Salad | 2025-07-11 | Laurie | Boise | $5 |
The concept of Tuples applies to both books:
- The ISG and TCW of Enterprise Intelligence – Each row of a dataframe is a tuple.
- The linked Markov Models of Time Molecules – Each case is a tuple.
Tuple Correlation Web
At the highest level of abstraction, it’s useful to know how strongly two tuples, of any type, are related, no matter what the method of similarity measurement. For example, there is obviously a strong correlation between the number of customers in a mall and sales. That’s not always the case, but it’s generally true. But there could be correlations that are not obvious, but can provide very much insight.
Figure 4 is a simple example of a web of correlations:
- The nodes are stock ticker symbols
- The edges epresent the strength of the correlation of the day to day price changes. In this case, the value of 0.65 is the Pearson correlation of the closing prices of MSFT and AMD over a period of time. The value of 0.65 is moderately strong, which means the day to day change of the closing price of the two stocks go up and down together fairly closely.
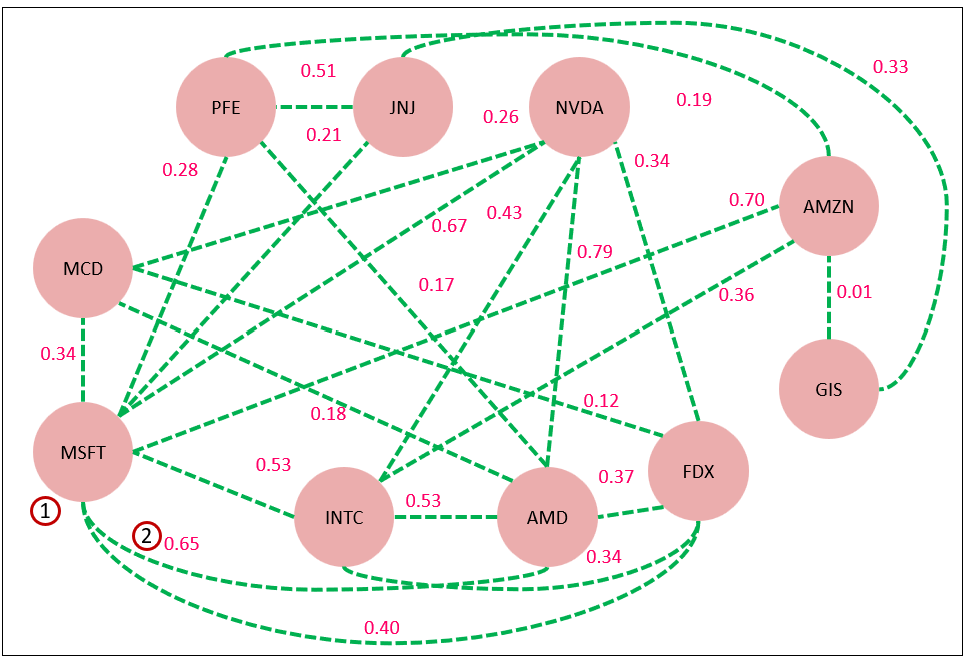
However, it’s important to note that the two tuples can be of completely different contexts, except for the timeframe. Tables 2 and 3 list a few examples of tuples of very different types. Table 2 are tuples of the tons of waste picked up on pickup routes.
| County | Waste Type | Week | Tons | Row Count (Homes) |
|---|---|---|---|---|
| Orange | Organic | 2025-07-01 | 12.5 | 1,234 |
| King | Recycling | 2025-07-01 | 8.2 | 987 |
| Maricopa | Landfill | 2025-07-01 | 25.0 | 2,450 |
Table 3 are tuples of fictional sales from fast food restaurants.
| State | Outlet | Date | Sales | Count (Tickets) |
|---|---|---|---|---|
| CA | McDonald’s | 2025-07-07 | $3,200 | 320 |
| TX | Burger King | 2025-07-07 | $2,100 | 210 |
| NY | McDonald’s | 2025-07-07 | $1,850 | 185 |
Figure 5 compares the values from a tuple in Table 2 (organic waste from Orange County) versus a tuple in Table 3 (sales for McDonald’s in CA) over the weeks from 2025-05-01 through 2025-07-01. Note the sales on the left for restaurant sales and right for tons.
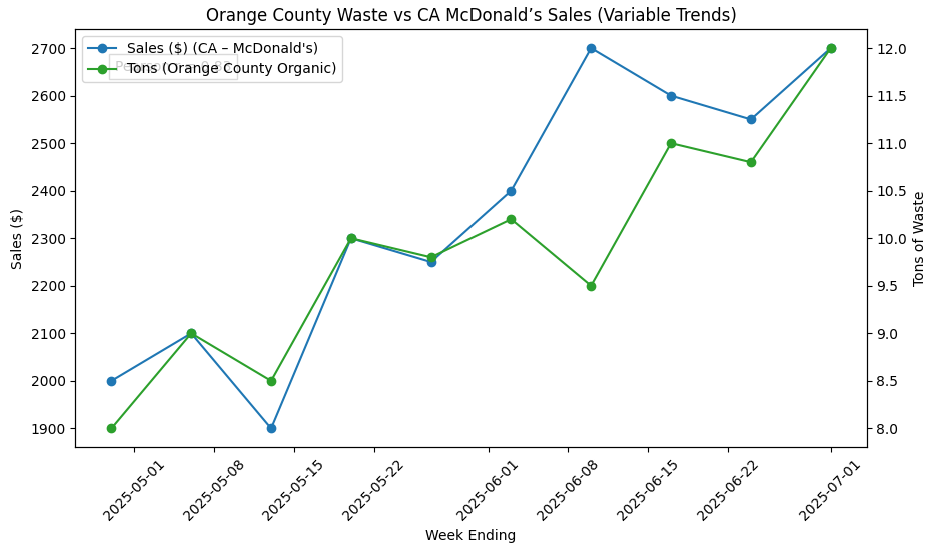
The two series mostly go up and down together, the exception being 2025-06-08. The Pearson correlation score is 0.83, a fairly strong correlation.
Although the relationship strengths between tuples of the TCW are Pearson correlations, there are other methods for measuring similarity:
- Pearson & Spearman Correlation: Both are linear-time (O(n)) statistics that run quickly on streaming data. Pearson captures linear relationships, while Spearman handles rank-based, monotonic associations—making them perfect for on-the-fly scoring.
- Weighted Composition Score: Breaks each item into its constituent entities and compares percentage compositions. By drilling down into subcomponents, you can score similarity from multiple perspectives (e.g. ingredient lists, feature sets).
- Conditional Probability: A Bayesian-inspired approach: P(A∣B) or P(B∣A) gives the likelihood of one event given another. Useful when you want asymmetric or context-sensitive similarity.
- Custom Functions: Any bespoke logic—Python/Java/C# functions in cloud Lambdas or Prolog rules—lets you encode arbitrarily complex domain knowledge. It’s the most flexible option, but harder to benchmark, optimize, and maintain at scale.
- LLM-Based Similarity: Embeddings from large language models can capture deep, contextual relationships where explicit functions don’t exist. Extremely versatile—but beware: these scores can reflect “educated guesses” and may hallucinate connections.
Note that the first three are computation light, which means we can calculate the similarity measure quickly and with high concurrency. But Custom Functions and LLM-Based Similarity open the door for more intense computation. And that’s OK, as long as the computation is worth it.
The big idea of the TCW is to work around the struggle involved with mapping data (things, properties, jargon) from domain to domain by recognizing that there is one dimension common to just about every domain database. That is time. It’s just one dimension, but it’s really the single most important one.
Strategy Map
A strategy map—from the Performance Management world—is a sub-structure of the TCW. It is a web of the correlation scores between the key performance indicators (I’ll generically call “indicators” KPIs for simplicity) status values. It’s such a powerful structure that it’s something I’ve written several blogs about it:
- Revisiting Strategy Maps: Bridging Graph Technology, Machine Learning and AI
- Bridging Predictive Analytics and Performance Management
- Prolog Strategy Map – Prolog in the LLM Era – Holiday Season Special
- Beyond Ontologies: OODA Knowledge Graph Structures
- KPI Status Relationship Graph Revisited with LLMs
The basic idea is that at certain intervals (maybe weekly), we take a snapshot of all the KPI metrics (value, target, trend, and most importantly, status). From these weekly snapshots, we can easily calculate the correlation between KPI statuses for an understanding of how they affect each other. This is important because managers often have no idea how their efforts to meet and/or exceed their KPI affect the KPIs of other managers, many that they have no idea exists.
Fortunately, KPIs already exist in most larger enterprises via their performance management system. However, although the KPIs are fairly low in level (for me there are a bunch of line items I need to meet), the reasons for the KPIs (what we expect to gain), the risks we wish to avoid (what we need to ensure doesn’t happen), and assumptions we make (if these start changing, chances are our plans have been punched in the face) aren’t sufficiently present.
Time Molecules: The Business Intelligence Side of Process Mining and Systems Thinking
Time Molecules is the process-oriented counterpart to the tuple-oriented OLAP cubes. The analogy is: As an aggregation of an OLAP cube is a compression of like transactions (facts) qualified by the elements of a tuple, Markov models are a compression of events within cases of a case type.
Cases are really like tuples in that they are a set of events typical of a process, qualified by properties. For example, the events related to renting a car—from the triggering need to rent a car, to making the reservation, picking it up, dropping it off, etc.— is a case. What qualifies it is the date of the reservation, the customer, the class of vehicle, the pickup location.
Table 4 lists examples of cases. Note that all cases have at least some sort of Case iD. We really don’t need:
- Case type since the events that make it up are the events no matter how we classify the events as a group.
- Start Date since the earliest event could be the start date.
- Properties is an open, variable bag of whatever is available and we think is of analytical value.
| Case Type | Case ID | Start Date | Properties |
|---|---|---|---|
| Manufacturing Lot | LOT-00123 | 2025-06-15 | { "batch_number": "BATCH-00123", "product_code": "PRD-45X", "plant": "Plant A", "shift": "Morning" } |
| Manufacturing Lot | LOT-00456 | 2025-06-20 | { "batch_number": "BATCH-00456", "product_code": "PRD-78Z", "plant": "Plant B", "operator": "Alice" } |
| Big Sale | SALE-20250701 | 2025-07-01 | { "customer_id": "CUST-1001", "region": "North America", "sales_channel": "Online", "order_value": 15000 } |
| Big Sale | SALE-20250705 | 2025-07-05 | { "customer_id": "CUST-1023", "region": "EMEA", "sales_channel": "Retail", "order_value": 27500 } |
| Onboarding Hiring | HIRE-EMP7890 | 2025-06-01 | { "employee_id": "EMP-7890", "department": "Engineering", "role": "Software Engineer", "location": "NYC" } |
| Onboarding Hiring | HIRE-EMP8034 | 2025-06-10 | { "employee_id": "EMP-8034", "department": "Marketing", "role": "Analyst", "mentor": "Bob" } |
| Termination Process | TERM-EMP7890 | 2025-07-10 | { "employee_id": "EMP-7890", "reason": "Resignation", "notice_period": "2 weeks", "exit_interview": true } |
| Termination Process | TERM-EMP8122 | 2025-07-12 | { "employee_id": "EMP-8122", "reason": "Retirement", "notice_period": "1 month", "pension_eligible": true } |
| Support Ticket | TCK-3001 | 2025-06-25 | { "ticket_id": "TCK-3001", "customer_id": "CUST-2002", "priority": "High", "issue_type": "Technical" } |
| Support Ticket | TCK-3054 | 2025-06-28 | { "ticket_id": "TCK-3054", "customer_id": "CUST-2045", "priority": "Low", "issue_type": "Billing" } |
Table 5 provides a description of the Case Types listed in Table 4. Every business process is a case type, so there could be dozens to hundreds of case types.
| Case Type | Event Names |
|---|---|
| Manufacturing Lot | Batch Created, Quality Inspection, Packaging Complete, Shipped |
| Big Sale | Order Received, Payment Processed, Order Picked, Order Shipped |
| Onboarding Hiring | Offer Extended, Offer Accepted, Orientation Completed, First Day |
| Termination Process | Notice Given, Exit Interview, Access Revoked, Final Pay Issued |
| Support Ticket | Ticket Opened, Technician Assigned, Issue Resolved, Ticket Closed |
The big idea of Time Molecules is that everything is a process, so we should study data at the level of a process.
Figure 6 shows a few examples for Markov models for three different processes—Web Site Visit, Patient presenting with a Transient Ischemic Attack (TIA), and Support Center Calls.

Interestingly, Markov models “predict” the next event in an analogous way to how LLM predicts the next token: both compute a probability distribution over possible continuations based on what came before. Where modern NLP leapt ahead was in its attention mechanism—dynamically weighting every prior token for each new prediction, rather than treating history as a fixed-length window.
In the Time Molecules framework, the analogous effect is the slicing and dicing by tuples of case-level and event properties—those slices acting as the “context” for a Markov model. In other words, instead of a learned attention matrix over token embeddings, we define context by selecting the right sub-Markov model (or combination of models) for the tuple at hand. That provides the flexibility to focus on the most relevant facets of a process—just as attention lets an LLM zero in on the most informative words—while retaining the interpretability and computational simplicity of classic Markov models.
Lastly, the Time Molecules book discusses a structure that is essentially the Tuple Correlation Web. As I mentioned, I introduced the TCW in Enterprise Intelligence, so the TCW is the common point where the two books tie together. The Markov models combined with the conditional probabilities of the TCW form hidden Markov models, which we’ll get to after a few more analysis topics in the Enterprise Knowledge Graph recommendation section.
High Query Performance of BI
I consider high query performance (return an answer to a query within a few seconds) as part of the user-friendliness of BI because it’s not very friendly to make someone wait a long time. This has been very tricky as the quantity and breadth of data has continuously exploded over the last two decades.
At first (late 1990s through 2010ish) SQL Server Analysis Services (SSAS) was the pre-eminent technology for that task. From around 2010, the notion of fast results were mostly masked from the MPP databases as well as the scale-out of Spark. That does work well, but ultra-fast querying still requires the principles of pre-aggregated OLAP.
Today, Kyvos is the preeminent technology for pre-aggregated OLAP as well as a powerful sematic layer. The level of querying provided by Kyvos
Figure 7 depicts the two methods. On the right, a pre-aggregated OLAP cube composed of aggregations of sub-cubes, a compression of up to trillions of data facts. The differently colored sub-cubes illustrate a pre-aggregation of a subset (sub-cube) of our OLAP cube—each called an “aggregation”.

Pre-Aggregated OLAP Cube
The pre-aggregation of OLAP cubes are able to substantially reduce query response time because the nature of “slice and dice” queries off dimensional models is that pre-calculated the inevitable sum and count calculations saves the time of calculating off what could be millions to trillions of facts on the fly, while the human analyst waits. For example, if the user asks, “What are the sales of tater tots in Idaho for 2015, that can involve millions of line items sales and take a while to calculate. But with pre-aggregation, there is probably a pre-calculated table (an aggregation) with the columns: Product, Location, Year, Sales. The answer to that question is one row away, not millions of rows.
Now, the catch is we cannot pre-aggregate every possible combination of attributes—which is a combinatorial explosion of attribute combinations. But there are methods for taking really good guesses, based on clever settings and user utilization, as to what combinations should be. That “smarts” is a big part of an enterprise-class BI platform (like Kyvos)—which has been AI-enhanced for a while now.
These blogs dives a little deeper into the benefits of pre-aggregated OLAP power of Kyvos:
- The Ghost of MDX – A shallow dive into the workings of OLAP cube aggregations.
- The Role of OLAP Cubes in Enterprise Intelligence – As AI interaction moves from one-shot queries to iterative processes (ex. RAG, Chain of Thought), some parts of those processes with be queries to databases, particularly BI databases. OLAP cubes can ensure the answer to ubiquitous slice and dice queries are returned as consistently fast as possible.
- All Roads Lead to OLAP Cubes … Eventually – A fun cartoon of how IT departments realize they need OLAP cubes.
- The Effect of Recent AI Developments on BI Data Volume – When the volume of data exceeds the feasible capability of the compute infrastructure, optimization methods are required. AI and IoT are taking us there quickly.
Process Side of BI
On the left side of Figure 5 above are a set of Markov models (actually they are hidden Markov models, but more on that later in this blog), a compression of thousands to trillions of cycles of the processes that comprise an enterprise and its surrounding ecosystem. The set of Markov Models are compressions of TIAs in Boise for each of the years 2016 through 2021.
As an aggregation is a compression of very many facts into substantially fewer rows of sums and counts, a Markov model is a compression of very many process cycles (cases) each consisting of a number of event into a few event transitions. Both aggregations and Markov models are caches of computation that transform raw data into information and are cached for re-use.
Preserving Compute
The last point I just mentioned a few paragraphs ago is incredibly important: When the volume of data exceeds the feasible capability of the compute infrastructure, optimization methods are required. AI and IoT are taking us there quickly.
In the BI world, the last decade has accommodated the computation of more data primarily through scaling up. Think also of scaling up more data centers to accommodate ever more powerful AI. It’s gone crazy. At least in the IoT world, efforts to mitigate compute and network bandwidth have been provided through edge computing.
In the BI world, as well as in the AI world where AI RAG processes would query BI data, pre-aggregated OLAP serves a powerfully valuable service—that is, preserving and managing very expensive compute for re-use.
Knowledge is Cache
Do you know what else is cache besides pre-aggregations and Markov models? Information and knowledge.
The KG nodes and relationships are information, things we’ve learned and/or expensive and time-consuming computations from raw data—whether computed from our brains or massive data sets and fancy algorithms. The good news is we calculate it once and access it many times. The bad news is the world is constantly changing and so will our information. So what good is a knowledge graph if the knowledge it holds is prone to inevitable change?
As of today, KGs pretty much reflect the current definition of the composition of things and how they are currently related. Outdated definitions are simply overwritten. However, it would be ideal if KGs maintained a record of how things evolved—that is, maintain a history of how things changed. This is like the Type 2 slowly-changing dimensions of the BI world, where every change to some instance of an entity (like a customer) is recorded, so that we know the characteristics of that instance at the time.
However, there is the argument that the world is constantly changing—it seems faster and more apparent the past few years—so caching knowledge is worthless. In an ideal world, it would be nice to go back to first principles and the raw data for every decision. There is a time for that. But if caching knowledge were worthless, the meaning of learning is senseless. Here are some thoughts on the value of cached knowledge:
- Latency of Updates: Sometimes the freshest information hasn’t propagated yet—news is delayed, systems haven’t synced, or data is hidden. Your last known state is still your best starting point, provided you treat it as provisional.
- Context of Decisions: A snapshot of knowledge—“the world as we saw it then”—provides crucial context for why decisions were made. That historical context is a cornerstone of wisdom, not just raw intelligence.
- Varied Time Scales: Everything changes at its own pace: protein folding occurs in picoseconds, human lifetimes span decades, and continents drift over millions of years. Your cache must respect these rhythms, refreshing critical fast-moving facts often while allowing slower-changing truths to endure.
In practice, the trick is to marry caching with governance: track the when and why of every update, tune refresh frequencies to each domain’s tempo, and always record the provenance of your knowledge. That way, the KG becomes not just a static map of today’s reality, but a layered chronicle of how reality has unfolded—and a more reliable foundation for future insights.
Recommendation: The Enterprise Knowledge Graph
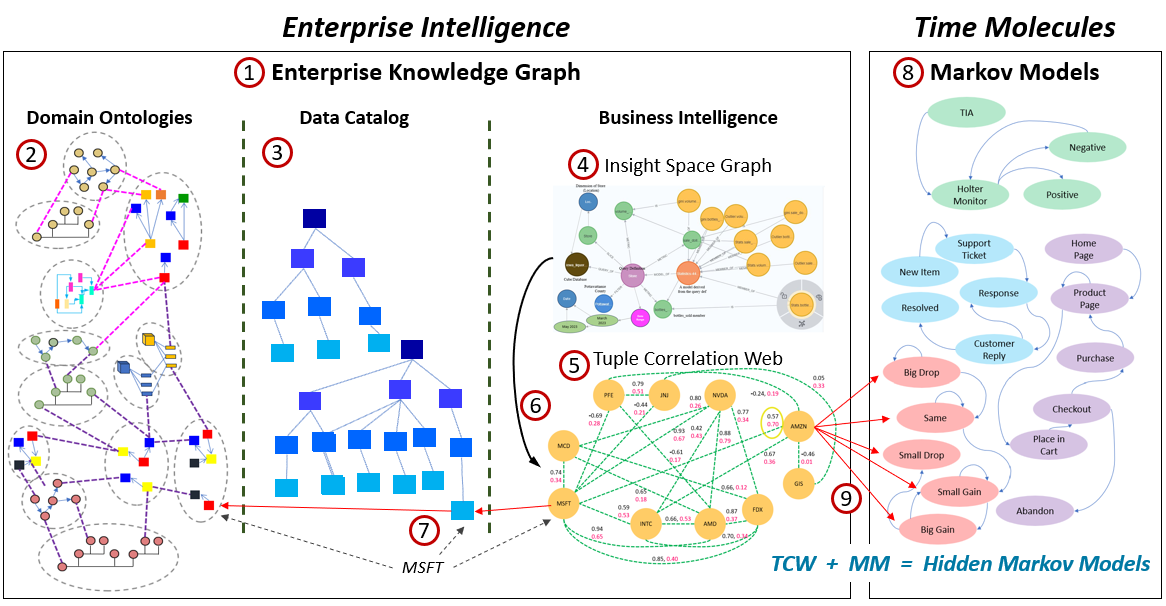
Here is where the two books come together. The end product of both books is an extended knowledge graph called the Enterprise Knowledge Graph (EKG). The two books link from the TCW of Enterprise Intelligence to the Markov models of Time Molecules to form a web of Hidden Markov models. Figure 8 shows how the EKG, the protagonist of Enterprise Intelligence links with the Markov models of Time Molecules.
The EKG is beyond ontologies and taxonomies that are typical of a knowledge graph. The knowledge graph component of the EKG (2 in Figure 8) provides the ontological definitions that aren’t normally captured in the workhorse relational databases. This includes implied relationships between tables that are beyond the very general “foreign key and primary key” to something more specific. Really, you could say the two books and those blogs I just mentioned are about extensions to a typical knowledge graph, as these blogs demonstrate:
- Beyond Ontologies: OODA Knowledge Graph Structures
- Embedding Machine Learning Models into Knowledge Graphs
Although the EKG is presented as part of Enterprise Intelligence, it was just introduced in that book and extends to include the Markov models of Time Molecules.
Following are descriptions of the numbered items in Figure 8.
- The EKG is composed of three sub-graphs (2, 3, 4)—at least as introduced in Enterprise Intelligence.
- The Domain Ontologies (Knowledge Graph) is a collection of ontologies authored (in a distributed fashion) by domains subject matter experts (SME) across the enterprise. They are linked together through RDF identifiers of the Semantic Web world. Within the EKG, it’s the part that gives human SMEs direct control over its structure—even though the use of LLMs for fact-checking, generating starting points, and converting from text to RDF/OWL is highly beneficial.
- The Data Catalog is a collection of metadata from data sources across the enterprise—from all types of data sources including OLTP, OLAP, IoT, etc. It generally consists of taxonomies of servers, databases, schemas, tables, columns, and selected values. These schemas are the result of craftsmanship between data engineers, business owners, and other stakeholders. The values (unique column values, property values) can include data that is ubiquitously used through the enterprise, small in volume (not millions of rows), and of course, not PII. For example, reference data.
- The Insight Space Graph (ISG) captures insights that can be easily derived from dataframes that are the result of regular BI queries. They are pretty much what the BI user will see in various visualizations (ex. line charts, pie charts). Think of it as a chart of an enterprise’s insight space.
- The Tuple Correlation Web (TCW) is a web of correlations and similarity scores between tuples. As described above.
- The ISG drives creation of tuple correlations. Each BI query results in dataframes, for which each row could be thought of as a tuple. For example, the usual BI slice and dice style query is essentially a SQL GROUP BY. Each row consists of GROUP BY columns, filters (WHERE clauses), and an aggregated metric (usually SUM or COUNT).
- Nodes from the ISG and the TCW that specify instances of an entity and/or property values (a database column value) should be linked through the data catalog if possible. There may be reasons it’s not because the KG has the freedom to store anything, even if it’s not present in any database across the enterprise.
- Markov models is to Time Molecules as OLAP aggregations are to our old friend, the BI OLAP cube. Markov models are as computationally light as SUM/COUNT aggregations—that is, approximately O(n).
- This is the link between the two books. The TCW plus Markov models create a web of hidden Markov models. Although the TCW is introduced in Enterprise Intelligence, it’s a foundational part of Time Molecules as well. The Markov models of Time Molecules teamed with the correlations of the TCW forms hidden Markov models, a structure that’s more powerful than Markov models and the TCW alone.
Why Hidden Markov Models Outperform Separate Markov Chains and Correlations
At their core, Hidden Markov Models (HMM) fuse the temporal, event-based rigor of Markov models (Time Molecules) with the probabilistic insights of correlation-based methods into a single, Bayesian-inspired framework (in the form of the TCW):
- Markov Models give you dependable transition probabilities between successive events or states—crafted case by case—so you know, for instance, that “Order Placed → Payment Processed” happens 95% of the time in your process logs.
- Correlation Webs (TCW) capture raw co-movement across pairs of time series—say coffee sales in Brazil versus sushi prices in L.A.—but they say nothing about the sequence or direction of change. Correlations are symmetric and blind to order, whereas Markov chains are asymmetric and inherently temporal.
An HMM overlays these two. If you query an unobserved “hidden” state sequence that follows a Markov model, and each hidden state probabilistically “emits” the observable signals that you also study via correlation. You therefore learn both (A) next event probabilities and (B) emission probabilities from the same data. The result is a model that can infer the most likely hidden state behind noisy observations, predict future observations more accurately, and gracefully handle missing or ambiguous data—because the Bayesian machinery lets each component reinforce the other.
Figure 9 illustrates a very fictional example. Imagine a patient who first presents with a TIA, then goes on a Holter monitor, and receives either “Positive” or “Negative” test results. In an HMM we treat those test outcomes as the hidden health state and the subsequent actions—“Implant Pacemaker,” “Pacemaker Not Helpful,” or “Insurance Decline”—as emissions. Each hidden state has its own transition probabilities (TIA → Holter Monitor → Positive/Negative) and emission probabilities (ex. Positive emits “Implant Pacemaker” 85% of the time), just like in the diagram above.
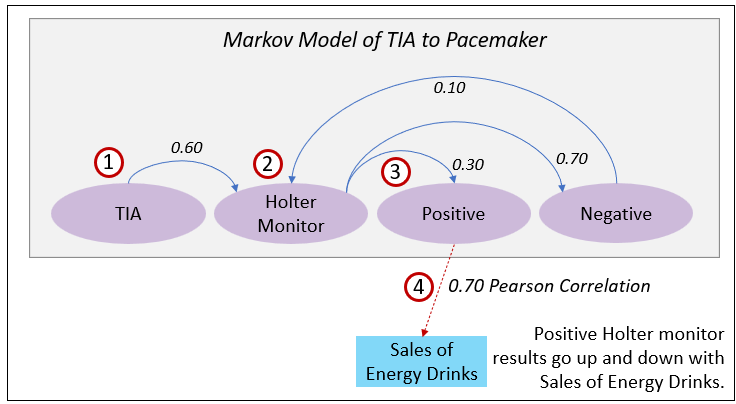
Here is a description of the numbered items in Figure 9:
- Given TIA (transient ischemic attack), Probability of Ending up with a pacemaker.
- TIA → Holter Monitor: 0.60
- Holter Monitor → Positive: 0.30
- Positive → Implant Pacemaker: 0.85
- Total probability: 0.60 * 0.30 * 0.85 = 0.153
- Given Holter Monitor Prescribed, Probability of Ending up with a pacemaker.
- Holter Monitor → Positive: 0.30
- Positive → Implant Pacemaker: 0.85
- Total probability: 0.30 * 0.85 = 0.255
- Given Positive Result from Holter monitor, Probability of Ending up with a pacemaker.
- Positive → Implant Pacemaker: 0.85
- This is a conditional probability from Positive event of a Holter Monitor result to an event completely unrelated to the data from which the Holter monitor Markov model was created and not obviously related. That is, Sales of Energy Drinks.
Focusing on Item 4, the 0.70 correlation (a moderate correlation) indicates that positive Holter monitor results go up and down with sales of energy drinks over time—say month to month over some timeframe of years. It’s very interesting because it’s not readily obvious to surgeons who perform pacemaker implants, nor is it in the clinical database, nor are there common dimensions aside from the ubiquitous time dimension.
Here are more details on Item 4, but remember, this is just a thought experiment for demo purposes:
- Why it’s interesting: Excess caffeine and stimulants (like taurine, guarana) can provoke arrhythmias, especially in people with underlying cardiac issues.
- Why it’s hidden: This data would live in a retail POS system or market tracker, completely outside of the EHR system.
- How it could correlate: An uptick in energy drink sales in a region could precede or coincide with an increase in positive Holter results due to cardiac disturbances.
- Time bucket correlation: Lagged correlation in 7–30 day windows might show strongest signal.
EKG Most Important Points
There it is, a middle way approach to apply AI in the enterprise where:
- AI is built on top of a Solid BI Foundation. We didn’t just throw the disciplined engineering of the BI system out the window hoping AI will just make analytics magically easy.
- The vast majority of our language is spoken in Tuples.
- Human Knowledge Workers are Intricately Tied to the Physical World. Databases are more fixed.
- Everything is a process. So we include the ability to engage a wide breadth of evolving processes and events.
Because the EKG is both a cache and a chronicle, it lets an AI agent in a RAG pipeline issue SPARQL or Cypher queries, invoke SWRL or reasoner proofs, and corroborate or supplement answers with the most current—and the most contextually relevant—knowledge. And by recording every update (like Type 2 slowly changing dimensions), we preserve the why and when behind each fact, so our AI isn’t just working off a snapshot, but a full history of how our business—and our understanding of it—has evolved.
In the end, the Enterprise Knowledge Graph is more than a data structure. It’s the solid BI foundation that makes genuinely intelligent, trustworthy AI possible—extended, enriched (KG), grounded (KG and DC), far-reaching (ISG), correlative (TCW), and process-aware (Time Molecules).
Conclusion
That is the gist of my how my two books as well as my two cents of:
- What a “map” that an agentic entity (human or AI) needs to make its way through the world by making better decisions and employ some level of creativity—sculpted from over 25 years of BI consulting/architecture/development.
- How we might integrate data from across what might be hundreds of databases throughout an extended enterprise ecosystem.
- How we incorporate into BI the fact that the world is more than made up of things, it’s made up of processes.
However, the EKG is just an integrated multi-perspective map. Over the next few months I’m posting a series on the processing mechanism for this EKG structure. Similar to how my blog series, Prolog in the LLM Era, began as “Appendix C” of Enterprise Intelligence that expanded into an 11-part blog series, this new blog series is an expansion of “Appendix F”, the NFA as the Time Crystal Complement to Time Molecules.
I’ll close with a couple of thoughts for dealing with the AI disruption.
Thinking About Thinking
Given the choice, I’d rather AI didn’t exist yet. I love to think. I’m never bored because I can do my favorite thing anytime, anywhere. But my guess is that AI will eventually “optimize” away the friction caused by any deviation from the normal curve, thus, removing the relevance of human thinking.
That sounds really horrible when I say it out loud like that.
I can only think that growing conversations with my new friends, ChatGPT and Grok, is playing with fire on that front—like how I need to purposefully exercise because I don’t need to plow fields and walk five miles to town. In fact, this morning I wrote this (July 10, 2025), the Internet in my area was down from 5:20am through about 11am. Pretty much all my work material is online, so my work schedule was severely hampered. Developing a huge dependency on AI exacerbates an already existing risk of something happening to the Internet!
Unless AGI/ASI becomes the almighty, all-seeing, all-knowing God, it ultimately can only solve our problems by herding us (the vast majority of us, anyway) into lowest common denominator compromises (as I imagine it was for the people under Vaal and Landru). The world is complex—even, my daily schedule is complex. So, for problems involving many interested parties with many competing goals, there isn’t a solution that will make everyone happy—unless we’re all OK with being forged into the same shape. I suspect the best the AGI/ASI will do will be a normal distribution where most are somewhat satisfied, some small percentage quite unhappy, and another small percentage very happy.
Almost everything I write about, whether in blogs or books, is about thinking about thinking. I think about thinking on my daily walks and hikes, and it even drives the recommendations on my YouTube feed. At the highest level, the two books, Enterprise Intelligence and Time Molecules, are a treatise towards thinking about thinking (in the context of my job as a BI developer/architect)—a reminder of the gift of sentience and agency we’ve all been given.
Embrace the Chaos to Keep Your Agency
My best thought to my software colleagues during this time of massive layoffs and AI is to realize that on the bright side, all bets are off as far as whatever secrets to success and unfair advantages there are. I’m a big fan of Scott Adams’ “skill stack” concept. With all the skills we can imagine, all the unique combinations of skills each of us have, the opportunity is there to create some unique set of skills where the whole is greater than the sum of its parts.
To analogize the sentiment of Dylan Thomas (“Do Not Go Gentle into That Good Night“), don’t fall willingly into the gradient descents of the AI models. As I’ve said many times, with or without AGI or ASI, we’re still sentient and sapient beings with loves, fears, hopes, and all that other wonderful stuff.
However, I have a feeling there is some level of reprieve from “AI taking our jobs”. This recent Gartner article, Gartner Predicts Over 40% of Agentic AI Projects Will Be Canceled by End of 2027, is very interesting, but who knows. I know the LLMs I’ve been using are terrible when it comes to pushing the envelope and its level of performance isn’t at “one nine” much less six nines. Meaning, when I’m working on pushing the envelope, I’m disappointed with the help of LLMs at least nine out of ten times.
It’s great at writing up “glossary” sort of text since glossary material is well-known. We’ll see how Grok 4 does when I have access to it …
Keep in mind, anything you do that goes smoothly and easily is automatable. So be mindful of anything that seems too easy. Sentience is the awareness of ourselves within a system and sapience is our ability to step outside of it and perform what the set of rules called “physics” might think are miracles. Think about telling your great-great-great-grandchildren (because the folks just starting out will probably live that long) fantastical stories about these Wild Days of Old AI.
Update (March 3, 2026)
It’s important to note that when I refer to “OLAP cubes”, I’m specifically highlighting the multidimensional data structure optimized for analytical queries—distinct from relational databases traditionally geared toward OLTP (Online Transaction Processing) patterns. Kyvos originally built on this OLAP foundation for high-performance analytics at scale (ca. 2015). However, the Kyvos platform has since evolved into a comprehensive semantic layer that delivers a unified, consistent business view across disparate data sources—ensuring “one view, one meaning” for metrics, dimensions, and relationships enterprise-wide. This semantic model retains the core acceleration structures for query speed and efficiency—even more valid today as multiple factors expand the need for trusted data—while expanding to support modern AI-driven insights, data mesh, and enterprise intelligence frameworks. OLAP described how it accelerated analytics. Semantic model describes what it represents. For the latest on Kyvos, check their official resources at kyvosinsights.com.
