TL;DR
Expert knowledge is more than facts, rules, procedures, or recipes. Its greatest value often appears when the normal procedure runs out: an unfamiliar failure, an ambiguous observation, or a situation for which no one has already written the answer. Experts draw on a mental model of how the world works, form competing explanations, predict what evidence each explanation should leave behind, decide what to examine next, and revise their thinking as new evidence appears. Geology makes this unusually visible because geologists routinely reconstruct processes and histories from traces left behind.
My attempt to capture this kind of knowledge is what I call an Expert Reasoning Graph (ERG). The idea is to preserve not just conclusions, but the reasoning around them: observations, context, mechanisms, competing hypotheses, predicted evidence, contradictions, investigations, confidence, and revisions. Particular cases can remain connected to the evidence that supports them, while recurring structures across many cases can gradually become more general mechanisms useful for forensics, risk analysis, prediction, and intervention. In an enterprise, the graph provides possible mechanisms and explanations, while the semantic layer supplies the governed analytical evidence needed to test and revise them.
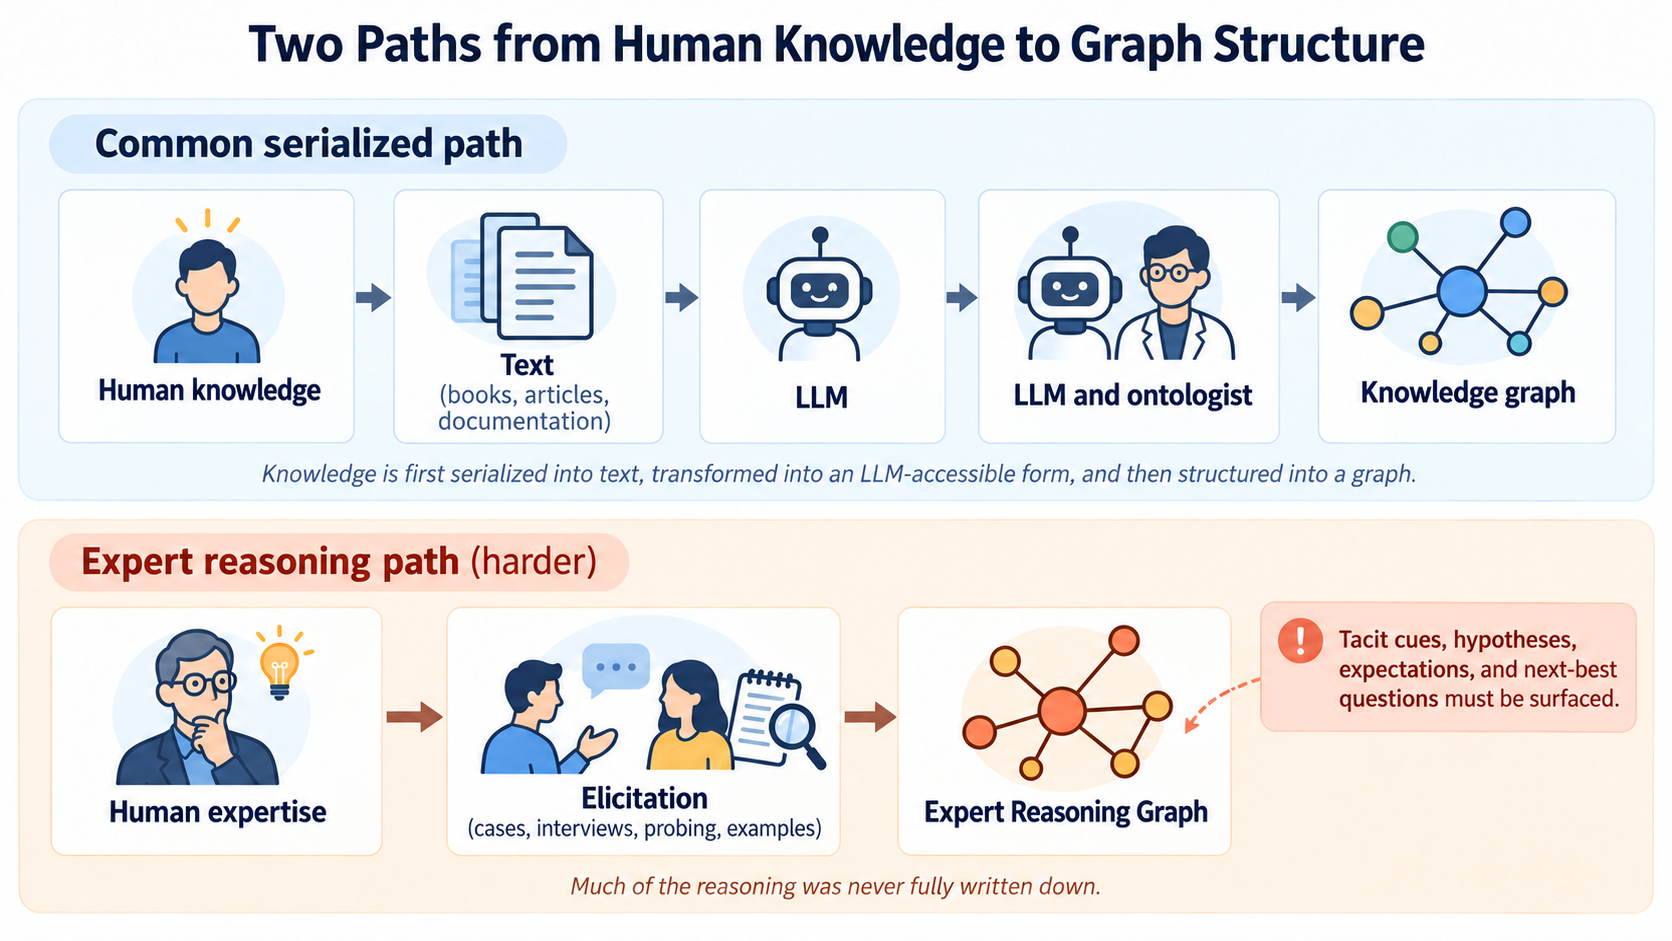
This may be among the hardest kinds of knowledge graph to construct because much of the knowledge being captured is practical expertise that has never been formally written down (Figure 1). But this is also where today’s LLMs substantially change what is feasible. A subject-matter expert no longer has to personally turn decades of experience into book-quality prose or formally model every relationship. They can describe cases, exceptions, hunches, context, and how they think through difficult problems; an LLM can help elicit what remains implicit, contribute relevant domain knowledge, organize the material, and propose graph structures for the expert to validate and refine.
I have worked on something akin to this. The SQL Server performance-tuning graph I attempted to construct in 2005 took months of work for just what we’d call today an MVP. With today’s LLM assistance and mature graph tools, I believe much of that effort could be reduced to weeks—something I discuss in Conditional Trade-Off Graphs – Prolog in the LLM Era or Enterprise Intelligence, SQL Server Performance Tuning Web, page 53.
The goal is not to automate away the expert. It is to make more of the expert’s transferable reasoning explicit and traversable—including the details that are rarely captured even in high-quality documentation of the software, systems, or processes they work with: the exceptions, contextual clues, competing explanations, causal understanding, and judgment that experienced people accumulate over years. Those are the things people and AI need when the next problem has no known recipe.
Notes before we begin:
- This blog is based on a “deleted scene” of my book, Semantic Webs of Meaning. Specifically:
- Extending Beyond Ontology, Chapter 3, page 60.
- Knowledge Workers, Chapter 4, page 66.
- If purchasing Semantic Webs of Meaning from the Technics Publications website, use the code TP25 for a 25% discount.
- There is an RDF/Turtle model of the geology example that you can inspect with an ontology editor such as Stanford Protege.
Introduction
Enterprises increasingly capture what things mean and what happens. Semantic models and ontologies define business concepts, knowledge graphs (KG) connect them, and process and event models describe how work unfolds. In Semantic Webs of Meaning, I explore that semantic foundation and how an Enterprise Knowledge Graph (EKG) can extend beyond a taxonomy or ontology into richer forms of knowledge.
I have also written about several other graph structures that capture different kinds of expertise. For example:
- A strategy map represents the theory of a business: its goals, KPIs, risks, and the hypothesized cause-and-effect relationships through which it expects to succeed.
- A Conditional Trade-Off Graph / Trade-Off Semantic Network goes deeper into how configurations and conditions affect competing outcomes.
- Trophic cascades similarly show how disturbances propagate through interconnected systems.
I brought these structures together as extensions beyond conventional ontology in Beyond Ontologies: OODA Loop Knowledge Graph Structures.
And events provide yet another view. My 2nd book, Time Molecules, is concerned with the stories formed by sequences of events—what happened, in what order, which sequences recur, and how systems behave over time. An event can tell us that something happened inside a system. A sequence can reveal the process that unfolded.
Each of these captures something different, but they still leave an important form of enterprise knowledge difficult to capture. That is, how an experienced person reasons when the answer is not obvious or easily looked up (during my SQL Server troubleshooting days, I called it the “un-Google-able”).
A skilled troubleshooter doesn’t simply follow a process. Faced with an unfamiliar problem, they notice particular clues, draw upon a mental model of how the underlying system works, entertain several possible explanations, deliberately seek evidence that can distinguish among them, and revise their theory as new information arrives. A geologist identifying an unfamiliar rock, a database expert diagnosing a performance problem that has everyone else stumped, a security investigator reconstructing an intrusion, and an analyst explaining unexpected customer churn are doing variations of the same thing.
This is more than process documentation or the process flow discovered through processes such as Event Storming. It is also different from a strategy map or trade-off graph. The strategy map captures what the organization believes should lead to its goals. The trade-off graph captures how changes and conditions propagate through a system. Time Molecules captures what sequences of events actually occurred.
The additional question in this blog is:
Given these observations and everything I know about how this system behaves, what might have happened, what evidence should exist if I am right, and what should I examine next?
This returns to an idea central to my 1st book, Enterprise Intelligence (Tribal Knowledge: Most Understanding is Trapped in the Heads of Individuals, page 82). Some of an enterprise’s most valuable knowledge resides in its knowledge workers. It includes exceptions, workarounds, subtle contextual cues, lessons from failures, and the reasoning used when the normal procedure no longer supplies the answer. Capturing more of that knowledge would make it available not only to other people, but increasingly to AI.
In many ways, this entire blog is about exceptions. Routine cases are comparatively easy to capture. They can become procedures, decision trees, support scripts, workflow automation, documentation, and eventually training data. The difficult knowledge appears when the case does not fit the normal path.
And enterprises encounter those exceptions constantly. An automated support agent can resolve the cases that match what it has been taught, but sooner or later it encounters something that does not fit and escalates the customer to a human. The interesting knowledge is often in what that human does next: which odd detail catches their attention, which assumptions they stop trusting, which possibilities they consider, what they ask the customer, and what finally resolves the problem.
Software development has the same character. Writing the happy path is often the easier part. Much of the expertise of a strong programmer appears when software fails, an assumption turns out not to hold, several components interact in an unexpected way, or the system reaches a state nobody planned for. Diagnosing that failure requires a mental model of how the system works and the ability to reason from incomplete and sometimes contradictory evidence.
Yet exceptions are frequently treated as debris. The incident gets fixed, the support ticket is closed, the workaround is passed around informally, and the reasoning that solved the unusual case disappears. An Expert Reasoning Graph is partly an attempt to stop throwing that knowledge away.
This blog uses geology as an unusually clear example of such reasoning. Even though Sheldon Cooper says, “Geology isn’t a real science.”
Geologists routinely work backward from surviving traces to possible mechanisms and histories, use competing hypotheses to predict what other evidence should exist, and then deliberately seek that evidence. I will explore how the same knowledge can be made explicit and traversable through what I will call an Expert Reasoning Graph (ERG) connected to the semantic layer that supplies the governed analytical evidence needed to test and revise those explanations.
- Expert: Knowledge produced through prolonged experience, including what is rarely documented.
- Reasoning: How observations become hypotheses, how mechanisms are invoked, why particular evidence is sought, how alternatives are ruled out, and how the explanation changes.
- Graph: Those things are represented as traversable relationships rather than buried in prose.
It’s important to note that I do not mean Expert Reasoning Graph to imply that I have discovered a new species of graph. I arrived at this pattern through years of trying to capture and operationalize expert reasoning, particularly around difficult technical problems where the answer could not simply be looked up.
But since then, I have found a number of established and recent approaches that overlap with parts of what I am describing. Cognitive Task Analysis, for example, focuses on eliciting the cues, judgments, strategies, and knowledge behind expert performance; abductive and diagnostic reasoning deal with competing explanations and the evidence that can distinguish among them; argument and evidence graphs represent support and contradiction; and more recent work such as Clinical Reasoning Graphs makes diagnostic reasoning itself graph-structured. These are important points of comparison, but they are not the sources from which I constructed the Expert Reasoning Graph.
More broadly, I think that these are all valuable ways of structuring reasoning that remain relatively unfamiliar outside their respective specialties. I am not arguing that an Expert Reasoning Graph is the one correct place to begin. Depending on the problem, one might just as reasonably start with a causal graph, an argument or evidence graph, a diagnostic structure, a temporal/event graph, or a semantic model, and then extend it as the reasoning demands.
The important point is less the label than recognizing that graphs can represent not only what we know, but how we investigate, explain, challenge, and revise what we think we know.
Seen this way, this blog is also a sequel to two recent ones. In Knowledge Graph Serialization and LLM Deserialization, I explored natural language as a practical serialization layer between human knowledge and graph structure.
Figure 1 compares two paths to a knowledge graph. The first row shows the more common serialized path: human knowledge is written down as text and can then be ingested by an LLM and further structured into a KG by the LLM and an ontologist. Its advantage is scale: once knowledge has been serialized into books, articles, documentation, or other text, it can be reused broadly and, at sufficient scale and cost, can even contribute to training or shaping an LLM itself.
The second row shows the Expert Reasoning Graph path. It is harder because much of what we want to capture may never have been serialized into text in the first place. Instead, it resides in what an experienced person notices, suspects, rules out, expects, and chooses to examine next. Its advantage is that it can preserve tacit, case-sensitive reasoning, especially in domains where no one has written the equivalent of a book, or where the particular case has unique characteristics that require direct elicitation rather than retrieval from existing text.
There is a familiar analogy to software development. Human intentions and requirements somehow have to become an explicit software structure, with developers performing some of the translation that ontologists and knowledge engineers perform for a graph. We know how difficult that translation can be.
The other direct prior blog is Even ASI Cannot Escape Imperfect Information. That blog dealt with the condition itself: intelligence must act without possessing a complete and perfectly current model of reality. This blog takes up the next question: what should intelligence do when the available information does not justify certainty? Think of it as:
Imperfect information is the condition. Uncertainty is the consequence. Expert reasoning is the response.
One response is to preserve competing explanations, the mechanisms that could produce them, the evidence they predict, the observations that support or contradict them, and the questions most likely to reduce the remaining uncertainty. That is the role I am exploring with the Expert Reasoning Graph.
Table 1 situates the Expert Reasoning Graph among several neighboring knowledge structures and methods:
| Structure / method | Primary question | What it captures | Difference from an Expert Reasoning Graph |
|---|---|---|---|
| Ontology / Semantic Model (domain model) | What exists, and what does it mean? | Concepts, properties, classifications, relationships, measures, dimensions, and shared definitions | Supplies the world model and governed meaning; it does not by itself represent how an expert investigates a particular unexplained case. |
| Strategy Map (strategic model / diagram) | What matters, and how do we believe success will be produced? | Goals, KPIs, strategic objectives, risks, and intended cause-and-effect relationships | Represents an organization’s theory of how desired outcomes should be produced rather than the reasoning used to diagnose what is actually happening. |
| Conditional Trade-Off Graph / TOSN (graph model) | What affects what, under which conditions and trade-offs? | Conditional causal interactions, constraints, competing effects, configurations, and context-dependent relationships | Represents how a system can behave; it need not represent the expert’s evidence-seeking investigation of a particular case. |
| Trophic Cascade / Causal-Process Graph (causal model / graph) | How can a change propagate through an interconnected system? | Chains and webs of causal influence, indirect effects, dependencies, and feedback | Represents propagation through the system rather than the reasoning used to determine which of several mechanisms actually operated in a particular case. |
| Time Molecules (temporal/event model) | What happened, in what sequence, and what patterns recur? | Events, states, transitions, durations, recurring histories, and stories emitted by systems | Provides the traces and histories from which an explanation may be constructed; the ERG asks what mechanism produced those traces and how an expert would determine that. |
| Causal Knowledge Graph (graph model) | Through what mechanisms can one condition or event produce another? | Generalized causal mechanisms and pathways | Provides much of the causal world model. An ERG adds the epistemic investigation around a particular case: alternatives, predicted evidence, tests, support, contradiction, and revision. |
| Cognitive Task Analysis (family of methods) | What knowledge and cognitive skill underlie expert performance? | Cues, mental models, judgments, strategies, decision requirements, and other aspects of expertise | A family of methods for eliciting, analyzing, and representing expert cognition. Rather than competing with an ERG, CTA can help surface the knowledge and reasoning that an ERG would need to represent persistently. |
| Clinical Reasoning Graph (graph representation) | How did diagnostic reasoning move among competing diagnoses as evidence accumulated? | Clinical features, diagnoses, discriminating features, supporting and opposing evidence, and changes in diagnostic emphasis. | A particularly close domain-specific example. CRGs analyze diagnostic reasoning traces; the ERG described here is broader, persistent reasoning knowledge connected to mechanisms, predicted evidence, investigation, event history, and operational data. |
| Expert Reasoning Graph | Given these observations, what might be happening, what evidence should exist, and what should I examine next? | Observations, mechanisms, competing hypotheses, predictions, targeted investigation, evidence, exceptions, and revisions | The focus is the reasoning process itself, connected to the world model, event history, and actual enterprise evidence. |
Please see Appendix A for a deeper dive into Cognitive Task Analysis and Clinical Reasoning Graph.
Reconstructing the Past from Traces
There are sciences in which the object of study is sitting in front of the scientist, ready to be manipulated. Change the voltage, temperature, pressure, or concentration and observe what happens.
Many laboratory problems in physics and chemistry can work this way. Mature theories provide models of how things should behave, and experiments can test predictions under controlled conditions. This does not mean that physics at this point is merely deductive, nor that physicists no longer invent hypotheses. But most of the work sits on top of a well-developed theoretical framework and asks what should happen if the theory is correct.
Geology and history often face a different problem. The events have already happened—across long stretches of time, under constantly changing conditions. A mountain range rose and eroded. A sea disappeared. Lava flowed and cooled. Sediments accumulated, were buried, tilted, faulted, and exposed again millions of years later. For history, an empire collapsed, a population migrated, a battle was fought.
Like it is for detectives, geologists and historians, the investigator arrives much after the facts. What remains are clues to be reconstructed into interpretations, which may become the seeds of theories. In the case of geology, hopefully the geological interpretation/model is valuably applied millions of times by interested parties.
Table 2 lists industrial and environmental applications of geological discoveries and theories.
| Geological interpretation or model | Clues used to construct it | Industrial application | Environmental / public application |
|---|---|---|---|
| History and structure of rock layers | Outcrops, cores, fossils, sedimentary layers, seismic data | Locate oil, gas, coal and mineral-bearing formations; guide drilling and tunneling | Understand aquifers, groundwater movement, erosion and land stability |
| Ancient depositional environment | Grain size, sedimentary structures, fossils, mineral composition | Predict where reservoir rocks, coal seams, sand, gravel or placer deposits may occur | Reconstruct past climates and coastlines; anticipate erosion and sediment movement |
| Fault and tectonic history | Faults, folds, displaced strata, earthquake records, rock deformation | Choose locations for mines, tunnels, pipelines, dams and geothermal projects | Estimate earthquake, landslide and volcanic hazards |
| Magma and hydrothermal history | Igneous rocks, alteration minerals, veins, temperature/pressure indicators | Find copper, gold, silver, lithium and other mineral deposits; identify geothermal resources | Understand naturally occurring metals and contaminants in soil and groundwater |
| Groundwater system | Porosity, permeability, fractures, wells, water chemistry, stratigraphy | Locate water supplies for agriculture, manufacturing and communities | Track contamination, protect aquifers and design remediation projects |
| Weathering and erosion history | Soils, sediment, slope geometry, river deposits, landforms | Plan roads, foundations, quarries and other infrastructure | Predict erosion, landslides, flooding and sediment delivery to rivers |
| Glacial history | Till, moraines, striations, transported rocks, buried valleys | Locate sand, gravel and groundwater resources; understand foundation conditions | Reconstruct climate change and understand modern watershed behavior |
| Subsurface containment | Rock type, permeability, faults, caprock, pressure history | Evaluate underground storage of natural gas, hydrogen or CO₂ | Assess whether injected CO₂ or hazardous materials are likely to remain contained |
| Geologic history of an ore deposit | Mineral associations, alteration, structures, geochemistry and age | Predict where undiscovered portions of a mineral system are likely to occur | Anticipate acid mine drainage and natural or mining-related metal contamination |
The important point is that these aren’t merely descriptions of the past. A reconstruction becomes a model that can be applied somewhere the answer is not yet known. A geologist concludes that a particular combination of sedimentary structures, rock properties and geometry was produced by an ancient river system; that understanding can then help predict where permeable sand bodies continue underground.
A geologist may have a road cut, a core sample, a sequence of sedimentary layers, mineral compositions, fossils, isotope ratios, and structures in the rock. Their shape, composition, texture, location, and relationship to the surrounding geology form a surviving record of processes that may have ended millions or billions of years ago. A historian may have letters, tax records, ruins, eyewitness accounts, laws, and artifacts. An archaeologist may have tools, pottery, bones, structures, and other material remains.
The evidence differs, but the reasoning is remarkably similar: the event is gone, but the record remains. From those traces, both try to reconstruct a story.
This makes geology and history particularly interesting models contributing to understanding an enterprise, a field that is usually not thought of as a science in quite this way.
An enterprise also operates inside a system bigger than itself and leaves traces everywhere. Transactions, customer interactions, inventory movements, security logs, advertising impressions, price changes, support calls, employee actions and financial results are all remnants of processes that have already occurred.
The idea is to draw inspiration from how geologists turn traces into explanations.
From Clues to Hypotheses
The reasoning involved is often called abductive reasoning: reasoning toward a plausible explanation.
Suppose a geologist encounters a layer of unusually rounded stones embedded in sediment. Several mechanisms could have produced it. Perhaps flowing water transported them. Perhaps they were reworked from an older deposit. Perhaps some other process was involved.
Abduction is the process of building a model around a problem, from which we can generate possible explanations. Then deduction from within that model can take over. If an ancient river transported these stones, what else should we expect to find? Particular sedimentary structures? Changes in grain size? A channel geometry? Related deposits elsewhere?
The nineteenth-century geologist T. C. Chamberlin deserves particular credit here. In The Method of Multiple Working Hypotheses, first published in 1890, he argued against becoming the intellectual parent of a single favored theory. Instead, the investigator should carry several plausible explanations at once, allowing observations to strengthen, weaken, combine, or eliminate them. The process becomes something like what is shown in Table 3.
| Stage | Step | Description | Example |
|---|---|---|---|
| 1 | Observation | Notice a pattern, anomaly, trace, or other evidence that needs explanation. | A sediment layer contains rounded clasts and cross-bedding. |
| 2 | Possible explanations | Generate one or more hypotheses that could account for the observation. | Ancient river, beach deposit, or windblown dune. |
| 3 | Predicted consequences | Ask what else should be true if each hypothesis is correct. | A river hypothesis may predict channel geometry, grain-size trends, and related downstream deposits. |
| 4 | Targeted observation | Deliberately look for evidence that can distinguish among the competing hypotheses. | Examine nearby outcrops for channel forms, fossils, or matching sedimentary structures. |
| 5 | Revised explanations | Strengthen, weaken, combine, or reject hypotheses based on the new evidence. | The river hypothesis gains support while the dune hypothesis becomes less plausible. |
More than a century later, philosopher of science Carol Cleland examined why this style of reasoning is especially important in historical sciences such as geology. Historical scientists cannot manipulate the original causes in a laboratory; they instead seek surviving traces and ask which past common cause best explains them. Cleland argues that this is not an inferior form of science, but a different evidential strategy arising in part from the asymmetry between past causes and the traces they leave behind. Take that, Sheldon Cooper!
Chamberlin gives us the discipline of multiple explanations. Cleland helps explain why traces of the past can discriminate among them. Both ideas are central to the Expert Reasoning Graph developed here.
An especially noteworthy step occurs between hypothesis and observation. The scientist doesn’t merely collect more data. The hypothesis suggests which data would be valuable to collect next.
That is part of the creative process.
A hunch that two distant rock layers might once have been connected can cause someone to search for a particular mineral, ash layer or fossil assemblage. The information did not simply arrive. Someone recognized that a particular missing fact could distinguish one story from another.
Rocks as Records of Process
I want to work through one example in enough detail to show what this kind of reasoning actually feels like. Geology works especially well because rocks are tangible, the underlying processes are understandable, and much of the reasoning begins with ordinary observation. Rockhounding makes it even more immediate: you pick something up, look at it, look around, and try to work backward toward what it is and how it came to be there.
I may be biased. I grew up in a place where the geology visible around me was mostly lava and coral, so finding an unfamiliar rock still feels a little like discovering evidence from another world.
But there is another reason I like this example: I know something about how this knowledge was built in me.
Born and raised in Hawaii, my original mental model of rocks was remarkably simple one-step cause and effect. Volcanoes produced lava. Coral eventually became sand.
Then a friend explained something he called the quartz cycle—really a quartz-centered path through the much broader and conventionally known “rock cycle”. It flipped a switch.
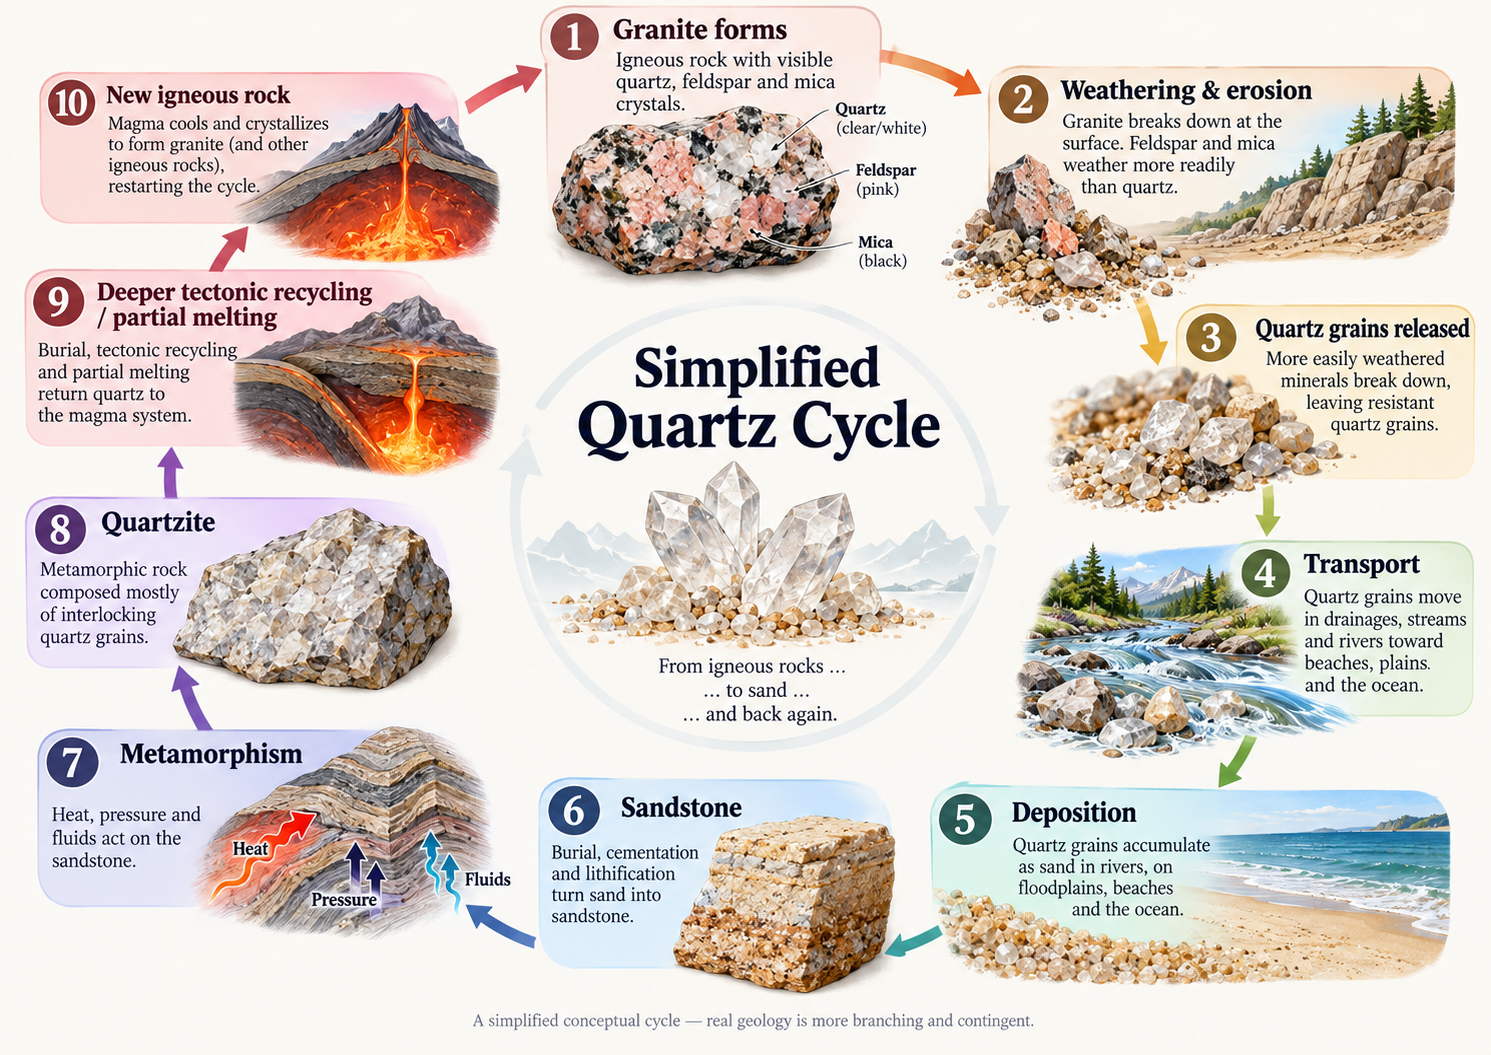
The simplified story began with granite, a crystalline igneous rock commonly containing quartz, feldspar, and mica. Exposed over long periods, the granite weathers and erodes. Feldspar and mica generally weather more readily than quartz, leaving resistant quartz grains that can be carried downhill through drainages and rivers. Those grains may eventually accumulate as sand in floodplains, beaches, basins, or the ocean. With burial and cementation, quartz-rich sand can become sandstone. With greater heat and pressure, sandstone can become quartzite.
And then the story branches.
Quartzite or other rocks may be uplifted and exposed again, returning directly to weathering and erosion without ever being deeply buried or melted. Other quartz-bearing rocks may continue into higher-grade metamorphic conditions; depending on their composition and tectonic history, gneissic rocks may develop. Material carried still deeper and heated sufficiently may partially melt and enter a magma system, eventually crystallizing into new igneous rock. Subduction is one route into deep tectonic recycling, but it is not the only one: continental collision, crustal thickening, burial, heating, uplift, and erosion provide other paths through the larger system.
The simple “quartz cycle” was therefore not quite a cycle once I learned more. It was a network with branches, shortcuts, repeated loops, and paths that particular rocks might never take. But the simple version did something important first: it stopped me from seeing a rock merely as an object with a name. Suddenly almost every rock had a history.
That changed how I learned geology. Instead of asking only What is this?, I began asking What processes could have produced this? What happened to it before I found it? What else should exist nearby if that story is right?
Appendix B (along with a nice graphic of the quartz cycle) develops the simplified quartz cycle because it was one of the ideas that made this kind of reasoning intuitive for me.
Note that I’m not a geologist. I just like rocks. What follows is not intended as a formal field-identification procedure. It is closer to a sample of the kinds of things I know, notice, and connect when I am trying to identify a rock in the field. With just that—and a few other things—I can sometimes seem like I know a lot more about rocks than I really do 🙂
The next several sections therefore spend some time on rocks and the processes that form them. The purpose is not to turn this into a geology lesson for its own sake, but to make the reasoning concrete before continuing to enterprise examples. If geology is not your thing, feel free to skip ahead to the enterprise sections. The same reasoning structure will reappear there.
Let’s Go Rockhounding
Imagine we are out rockhounding and someone hands me an unfamiliar green rock and asks, “Is this jade?” Lots of green rocks look like jade (the nephrite variety of jade in the area where I live).
I may not know immediately. I also may not work through a fixed checklist or decision tree. I look at the rock, but I also look around. What other rocks occur here? What have I seen in nearby washes? What formations are exposed uphill? Is the area volcanic, sedimentary, or metamorphic? Has there been uplift, faulting, hydrothermal alteration, or the kinds of pressure and temperature conditions that could produce particular minerals?
The green color alone does not answer the question. Depending on the setting, possibilities might include nephrite, serpentinite or serpentine-rich rock, green jasper or chert, green quartz such as aventurine or prase, epidote-rich rock, prehnite, chlorite-rich metamorphic rock, or other altered volcanic or metamorphic material. Some possibilities become much more plausible once the surrounding geology is considered; others become much less plausible.
I may then examine hardness, fracture, translucency, texture, density, mineral associations, weathering, or the character of the host rock. But which observation I make next depends on the explanation I am currently considering. I am not simply asking, “What rock looks like this?” I am asking, “Given this rock and everything I know about the system that produced or transported rocks in this place, what could it be, and what should I look at next to distinguish among those possibilities?“
That is the kind of knowledge I want an Expert Reasoning Graph to capture. It should not simply learn that Eugene usually calls rocks that look like this serpentine. It should preserve the observations, geological context, possible mechanisms, competing identifications, and discriminating evidence that led to that judgment.
Expert reasoning is often less like descending a decision tree than entering a graph at whatever clue happens to matter.
This jadeite/nephrite/serpentine/jasper example is good because it demonstrates the difference between image recognition and understanding. An image classifier—or an AI given only a photograph—might say, “This resembles serpentine.” The knowledge you want to preserve includes why serpentine would make geological sense here, why nephrite would or would not, what processes could have produced either, and what observation would help decide between them.
A decision tree or checklist can be extremely useful, but it is often the product of expert reasoning rather than the source of it. Once experts have encountered a problem often enough, some of their reasoning can be compressed into rules: if these properties are present, examine this next; if this test is negative, eliminate that possibility.
What tends to disappear in that compression is why those tests matter. Why should this observation distinguish nephrite from serpentine? Why should the surrounding geology make one explanation more plausible than another? What geological process would have had to occur for either material to be present here? What other evidence should that process have left behind?
An Expert Reasoning Graph is intended to preserve that deeper structure. A decision tree might eventually be derived from part of the graph for a recurring problem, and a checklist might summarize the most useful discriminating observations. But the graph retains the mechanisms, context, alternatives, and evidence from which those procedural shortcuts were created.
Even the question igneous, sedimentary, or metamorphic? need not be the first branch of a predetermined tree. I may suspect one of those categories because of what I already know about the place. A volcanic field, an uplift exposing metamorphic rocks, a landscape dominated by sandstone, or the assemblage of rocks carried down a wash changes which explanations seem worth pursuing. I still have to determine whether the specimen itself supports that initial suspicion.
That is why I am presenting them separately here:
- Sedimentary rocks often preserve sequence through time.
- Igneous rocks preserve clues about composition, emplacement, and cooling history.
- Metamorphic rocks preserve evidence of the pressure, temperature, fluids, and tectonic conditions they experienced after formation.
The reasoning also works in the opposite direction. Identifying a rock—or even explaining a rock well enough when no convenient name applies—can itself reveal a great deal about the environment and processes that produced it. A rock is not merely an object to classify. Its composition, texture, structure, mineral assemblage, and setting can provide evidence about transport, deposition, cooling, burial, metamorphism, tectonic history, and other past conditions.
Together, these three categories provide a simple example of expert reasoning. That is, begin with a broad classification, use it to narrow the mechanisms that could have produced what you see, and then use the rock itself as evidence for reconstructing the history behind it.
What follows is certainly not everything one needs to know to identify rocks or understand their history. I am barely touching plate tectonics, for example: what happens where plates converge, diverge, or slide past one another; why one plate may subduct beneath another; how collision produces uplift and mountain building; how magma, fluids, pressure, and temperature change with tectonic setting; and what those processes imply about the rocks that may occur in a particular place. All of that adds more nodes and relationships to the mental graph. My purpose here is not to provide a geology course, but to show enough of the connected knowledge that the reasoning becomes visible.
A note for those who never went rockhounding. The last time I regularly went rockhounding with friends was just before COVID—seven or eight short years ago. Some of the places we explored still had large Internet and cellular dead zones. ChatGPT did not exist, and the rock-identification apps available to us were still relatively immature. You could not assume that you could pick up an unfamiliar rock, point a phone at it, and receive a useful answer. Even when reference material was available, a picture or name was only part of the problem. You still had to look at the rock, look at the landscape around it, remember what processes could have produced what you were seeing, and decide what clue might help next. That’s all different today.
Sediments Are a Gift
Geology provides an unusually intuitive example because sediments often preserve time physically. This follows the Law of Superposition—in an undisturbed sequence, lower layers are generally older than those above them. Archaeologists use the same stratigraphic logic with artifacts and occupation layers.
A cliff or core sample—for example, the Colorado Plateau near where I live—can contain a sequence such as limestone, red sandstone, shale, volcanic ash and another sandstone. Measurements can be taken for each interval: mineral composition, grain size, elemental composition, fossils, age estimates and thickness.
It is almost an analytical data set waiting to happen.
Table 4 lists dimensions such as:
| Dimension | What it represents | Example |
|---|---|---|
| Location | Where the geological observation or sample was taken. | Core site A, 12 km east of a fault zone |
| Depth | Position below the surface or within a core. | 145–155 meters |
| Geological age | Estimated age or time interval represented by the material. | Late Jurassic |
| Formation | Named stratigraphic unit to which the material belongs. | Morrison Formation |
| Rock type | Lithology or rock classification. | Sandstone, shale, limestone |
| Mineral | Mineral species or assemblage present in the material. | Quartz, feldspar, calcite |
and measurements such as:
| Measurement | What it represents | Example |
|---|---|---|
| Thickness | Vertical extent of a layer or unit. | 4.2 meters |
| SiO₂ percentage | Proportion of silica in the analyzed material. | 62 wt% SiO₂ |
| Grain size | Typical size of sediment or mineral grains. | Fine sand, 0.2 mm |
| Porosity | Fraction of the rock volume made up of pore space. | 18% |
| Mineral abundance | Relative amount of a mineral within the sample. | 35% quartz |
| Isotope ratios | Relative abundance of isotopes used for dating, tracing sources, or reconstructing environments. | ⁸⁷Sr/⁸⁶Sr ratio |
| Elemental concentrations | Amounts of specific chemical elements in the material. | 2.1% Fe, 450 ppm Mn |
But sedimentary geology has another particularly compelling dimension: stratigraphic sequence—the ordered succession of rock layers through time.
Instead of treating each layer as an isolated observation, we can examine how its composition changes through depth and, by inference, through geological time. An illustrative section might look something like this Figure 2.
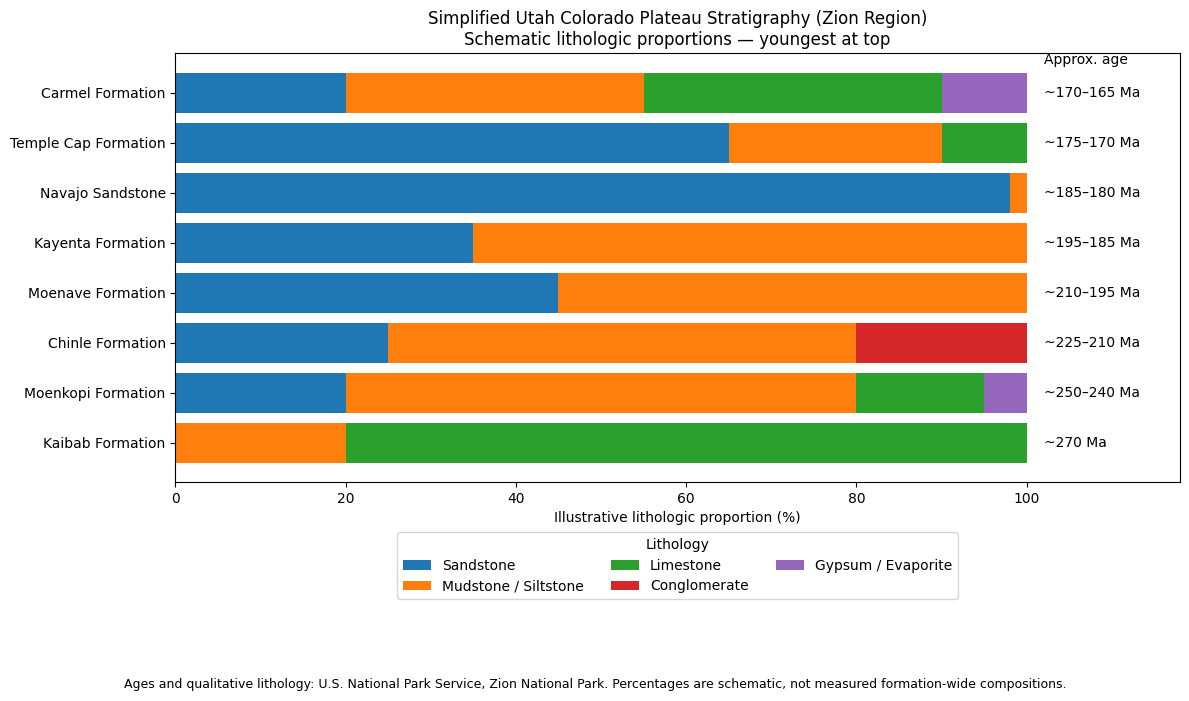
That is the order from oldest to youngest; the figure displays youngest at the top, as a stratigraphic column normally would. Figure 2 shows a selected sequence from Carmel through Kaibab
The strata include sandstone, mudstone/siltstone, limestone, conglomerate, and gypsum/evaporite. The Chinle certainly contains abundant volcanic-ash-derived bentonitic clay, but much of that ash has altered into the mudstone, so displaying “volcanic ash” as a discrete percentage would give a misleading impression. NPS specifically notes that the colorful mudstones of the Petrified Forest Member contain bentonite formed by weathering volcanic ash.
The percentages in the graphic are deliberately labeled schematic lithologic proportions. The sources describe lithology qualitatively; they do not say, for example, “the Kayenta is 35% sandstone and 65% mudstone.” Those percentages are a reasonable approximate visualization of the published descriptions, not analytical measurements. The ages, however, are taken directly from the NPS descriptions: Navajo ~185–180 Ma, Kayenta ~195–185 Ma, Moenave ~210–195 Ma, Chinle ~225–210 Ma, Moenkopi ~250–240 Ma, Temple Cap ~175–170 Ma, Carmel ~170–165 Ma, and Kaibab about 270 Ma.
Following are references:
- NPS — Zion National Park: Rock Layers — particularly useful because it provides the overall stratigraphic sequence. National Park Service
- NPS — Navajo Sandstone and NPS — Kayenta Formation — ages, lithologies, and dune versus river/floodplain environments. National Park Service
- NPS — Chinle Formation and NPS — Moenkopi Formation — especially useful for the mixed mudstone/siltstone/sandstone/conglomerate units and the volcanic-ash-derived bentonite in the Chinle. National Park Service
- NPS — Moenave Formation, NPS — Temple Cap Formation, and NPS — Carmel Formation — complete the Zion-area sequence. National Park Service
- Utah Geological Survey — Lake Powell’s Rocks — independently describes the Moenkopi, Chinle and Glen Canyon Group progression, including Kayenta and Navajo. Utah Geological Survey
- Utah Geological Survey — San Rafael Swell stratigraphy — useful confirmation from central Utah of the Carmel–Navajo–Kayenta–Wingate–Chinle–Moenkopi succession and lithologies.
With many measurements, other profiles could be plotted alongside it: grain size, mineral abundance, porosity, elemental composition, fossil occurrence or isotope values. Patterns that are difficult to notice sample by sample can become conspicuous when viewed across depth or time.
Now repeat this across many cores and exposed sections over a wide geographic area.
Modern imaging and AI could potentially turn photographs, core scans and instrument readings into very large matrices of observations tied to coordinates, elevations and stratigraphic positions. One location gives us a vertical sequence. Many locations allow us to compare those sequences horizontally as well.
This begins to turn geology into a genuinely multidimensional analytical problem:
| Analytical question | What it reveals | Geological example |
|---|---|---|
| What changed? | Changes in composition, properties, or conditions between successive intervals. | Limestone gives way to sandstone, followed by an ash-rich layer. |
| When did it change? | The position of a change within geological time or stratigraphic sequence. | The transition occurred between two dated formations or depth intervals. |
| Where did the same pattern appear? | Whether a similar sequence occurs at other geographic locations. | A comparable sandstone–ash–shale sequence appears in several distant cores. |
| Which layers appear to correspond? | Possible correlations between strata observed at different locations. | Ash layers with similar age and chemistry may represent the same eruption. |
But the measurements and sequences alone still do not tell the story. For that we need relationships.
Graphing Knowledge, Not Just a Dictionary
A simple geological KG might tell us that Basalt IS-A igneous rock. That is useful ontology, but it doesn’t capture much geological understanding. We’ll use the classification of igneous rocks as an example of encoding more understanding.
Before continuing, ironically, I would like to first introduce a dictionary of the terms.
| Term | Meaning | Example |
|---|---|---|
| Cryptocrystalline | Composed of crystals so extremely small that the individual crystals cannot normally be distinguished with the unaided eye and may be difficult to resolve even with an ordinary optical microscope. Exact boundaries vary by usage. | Chert, jasper, and much chalcedony consist of extremely fine crystalline silica. |
| Microcrystalline | Composed of crystals too small to distinguish with the unaided eye but resolvable microscopically. Exact size boundaries depend on the classification being used. | Microcrystalline quartz occurs in many siliceous rocks and can form cement between sediment grains. |
| Macrocrystalline | Composed of crystals large enough to be distinguished individually without a microscope. “Macro” does not imply that the crystals must be large in an everyday sense: they may begin around a millimeter in size, while favorable conditions can produce crystals centimeters or many inches across. | Ordinary quartz crystals, amethyst, citrine, smoky quartz, and rose quartz are macrocrystalline. |
| Aphanitic | A rock texture in which individual mineral grains are too small to distinguish with the unaided eye. In igneous rocks this commonly results from relatively rapid cooling. | Basalt and many rhyolites are aphanitic. |
| Phaneritic | A rock texture in which the constituent mineral grains are readily visible to the unaided eye. In igneous rocks this commonly results from relatively slow cooling underground. | Granite and gabbro are phaneritic. |
| Basalt | A dark, mafic igneous rock that forms when lava cools relatively quickly at or near Earth’s surface. It is typically aphanitic (very fine-grained). | Basalt commonly makes up oceanic crust and many lava flows. |
| Gabbro | A mafic igneous rock with a composition broadly similar to basalt, but formed by slow cooling below the surface. It is typically phaneritic (macrocrystalline). | Gabbro is common in the deeper parts of oceanic crust. |
| Rhyolite | A felsic igneous rock that forms when silica-rich lava cools relatively quickly at or near the surface. It is typically aphanitic (very fine-grained). | Rhyolite is the extrusive compositional counterpart of granite. |
| Granite | A felsic igneous rock that forms when magma cools slowly underground. It is typically phaneritic (macrocrystalline). | Granite commonly contains visible quartz, feldspar, mica, and other mineral grains and is widespread in continental crust. |
| Extrusive | Describes igneous rock formed from lava that reaches or approaches the surface and cools relatively quickly. Rapid cooling commonly produces an aphanitic texture, although volcanic rocks can also contain glass or larger crystals. | Basalt and rhyolite are typically extrusive. |
| Intrusive | Describes igneous rock formed when magma cools below Earth’s surface. Slower cooling generally allows larger crystals to grow, commonly producing a phaneritic texture. | Gabbro and granite are typically intrusive. |
| Mafic | A relative compositional category for igneous rocks that are generally lower in silica and richer in magnesium and iron than felsic rocks. “Lower in silica” does not mean that they contain little silica; mafic rocks are still dominated by silicate minerals. | Basalt and gabbro are mafic. |
| Felsic | A relative compositional category for igneous rocks that are generally higher in silica and richer in feldspar and quartz than mafic rocks. | Granite and rhyolite are felsic. |
Let’s start with the word, mafic.
Mafic rocks are often described as “silica-poor”. That phrase can be confusing because mafic rocks are still overwhelmingly composed of silicate minerals. Poor is relative. Compared with felsic igneous rocks, mafic rocks generally have lower SiO₂ and relatively more magnesium- and iron-bearing minerals.
The KG should therefore not stop at: Basalt → has composition → Mafic
It should be able to represent what mafic means:
| Subject | Relationship | Object |
|---|---|---|
| Mafic | is a | compositional category |
| Mafic | has relatively | lower SiO₂ |
| Mafic | has relatively | higher Mg and Fe |
| Mafic | defined according to | classification scheme |
The same graph can separately describe another dimension:
| Composition | Typical Mg and Fe | Typical source / crustal setting | Extrusive | Intrusive |
|---|---|---|---|---|
| Mafic | Mg ≈ 4–5%; Fe ≈ 8–10% (Relatively Low Silica-Still mostly silica) | Commonly derived from partial melting of the mantle, so its source is generally deeper. Mafic rocks dominate oceanic crust and are common in the lower crust and volcanic settings fed directly from mantle-derived magma. | Basalt | Gabbro |
| Felsic | Mg generally <1%; Fe commonly ~1–3% (Relatively High Silica) | Commonly associated with continental crust and shallower crustal evolution. Felsic magma may form through partial melting of crust, differentiation of more mafic magma, or both. It is especially common in subduction-related continental arcs, where mantle-derived magma and recycled crustal material interact. | Rhyolite | Granite |
And processes connect those classifications to observable properties:
- intrusive emplacement (underground) → slower cooling → larger crystals
- extrusive emplacement (above ground) → rapid cooling → smaller crystals
Now the graph doesn’t just know that gabbro tends to have larger crystals than basalt. It contains part of the mechanism that explains why.
Existing geoscience standards already move in this direction. GeoSciML, for example, distinguishes Earth materials, geological units, geological events, geological histories, processes, ages, observations and analyses instead of treating geology as nothing more than a taxonomy of rock names. SWEET similarly provides a modular ontology spanning thousands of Earth-system concepts.
What I am interested in is carrying that idea farther into a graph of mechanisms and explanations for enterprises.
Metamorphic Rocks Remember Conditions
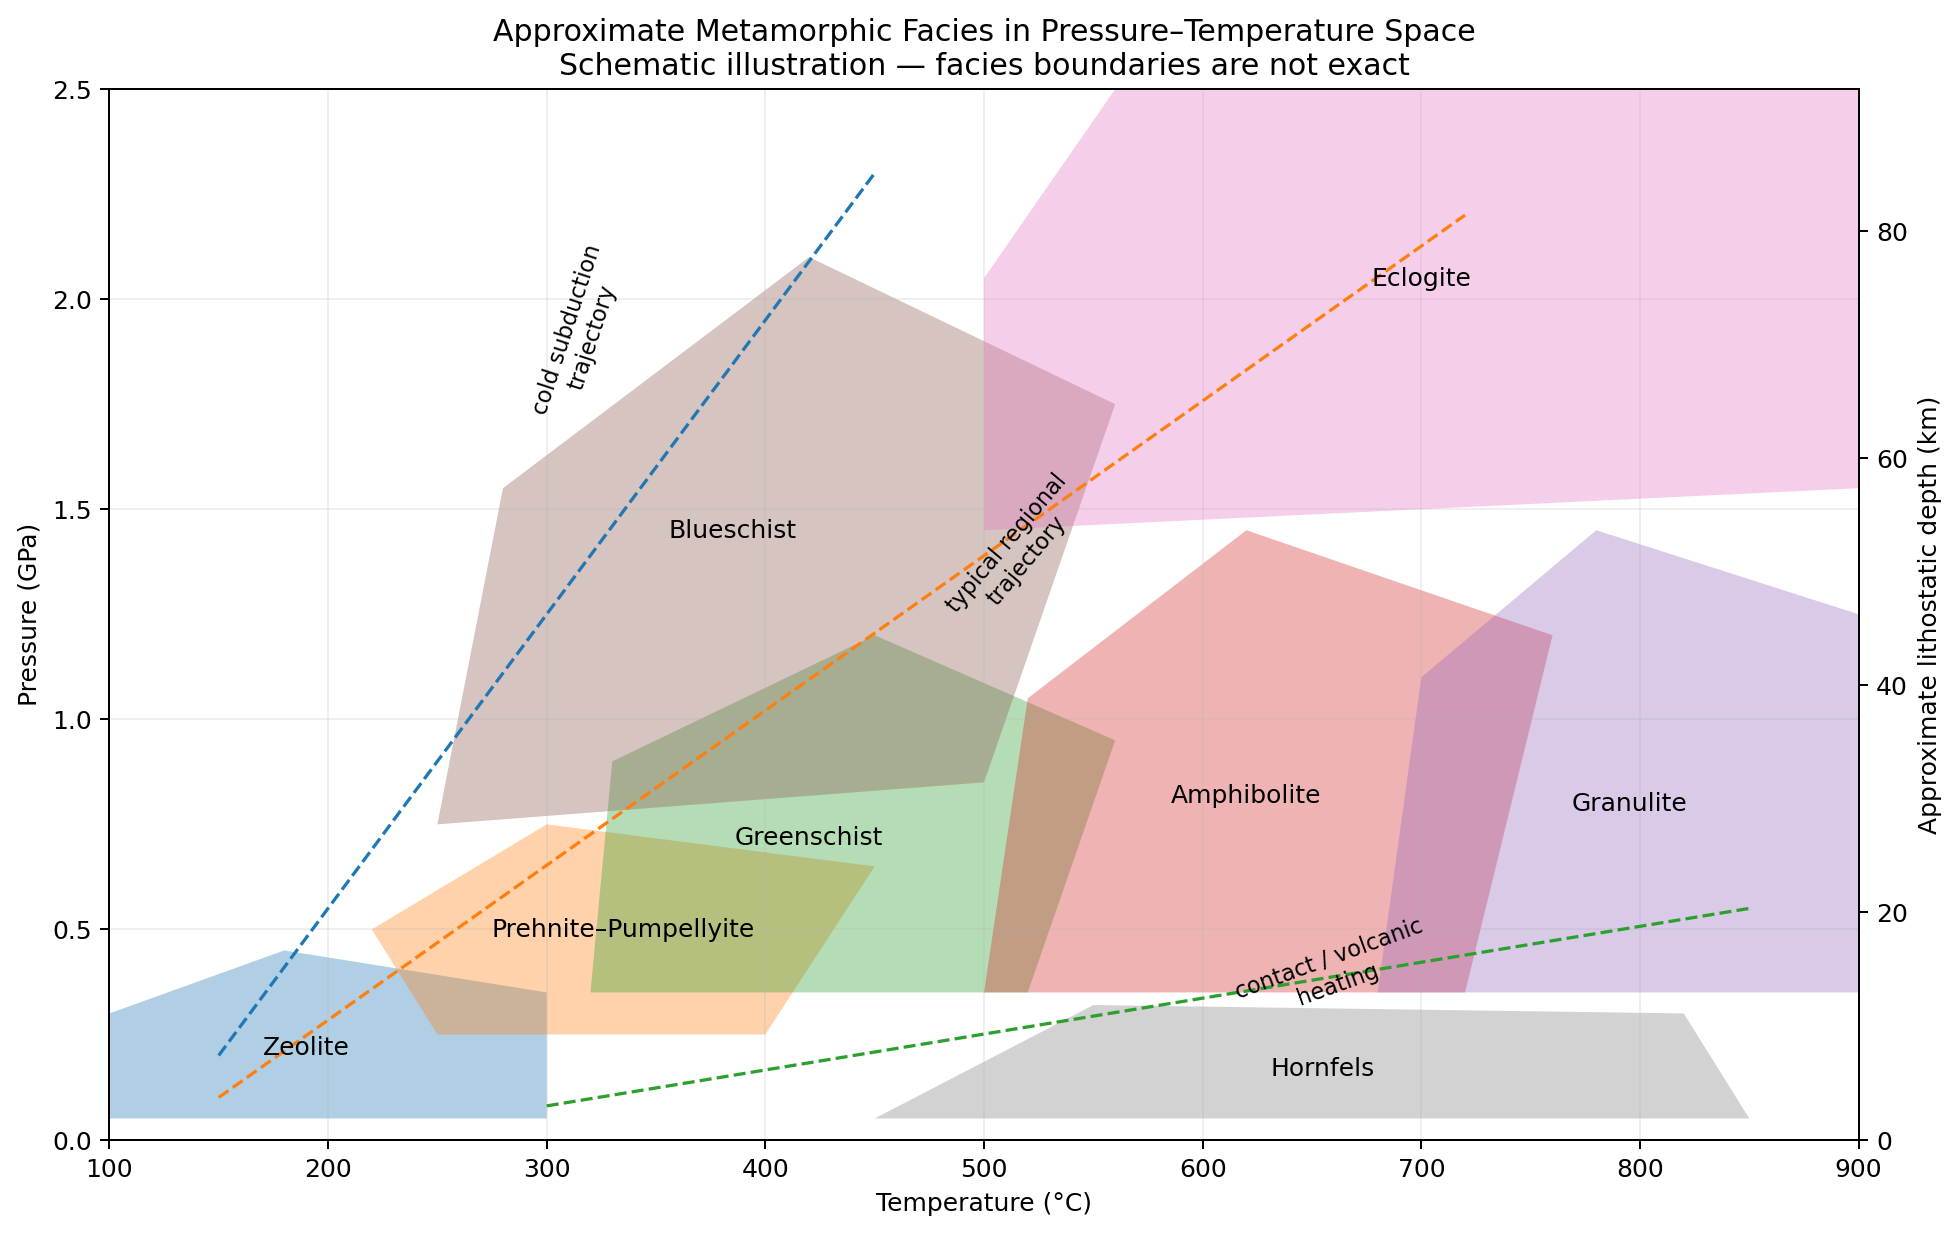
Metamorphic rocks offer another insightful form of geological knowledge. A pressure–temperature (P–T) facies diagram divides combinations of pressure and temperature into regions associated with characteristic mineral assemblages. High pressure with relatively low temperature can produce blueschist-facies assemblages characteristic of subduction environments, while high temperature at relatively low pressure can produce hornfels associated with heating near an intrusion.
The diagram is interesting computationally because pressure and temperature are continuous measurements, while the facies form recognizable regions within that two-dimensional space. I previously used this diagram as an analogy for a support vector machine: an SVM similarly learns decision boundaries from labeled examples. The geological boundaries, however, arise from physical and chemical knowledge rather than an ML classifier.
Even more interesting is using the diagram backward. A geologist encounters a particular mineral assemblage today and uses it to constrain the pressure and temperature conditions the rock experienced millions of years ago. The observation becomes evidence about an otherwise unobservable past state.
For an Expert Reasoning Graph, that gives us relationships such as:
| Subject | Relationship | Object |
|---|---|---|
| Blueschist Facies | associated with | High Pressure / Relatively Low Temperature |
| Hornfels Facies | associated with | High Temperature / Low Pressure |
| Mineral Assemblage | provides evidence for | Metamorphic Facies |
| Metamorphic Facies | constrains | Pressure–Temperature Conditions |
| Pressure–Temperature Conditions | support inference of | Tectonic Environment |
In other words, the graph can be traversed both forward—conditions → process → expected result—and backward—observed result → possible conditions → possible history.
Figure 3 illustrates an approximation of metamorphic facies in pressure–temperature space. Continuous measurements of pressure and temperature divide into recognizable facies regions associated with characteristic mineral assemblages. The boundaries are approximate, but the diagram illustrates how an observed assemblage can be used to reason backward toward the conditions and tectonic environment under which the rock formed.
References for Figure 3:
- U.S. National Park Service. NPS metamorphic facies diagram This diagram maps the major metamorphic facies onto pressure and temperature. It shows, for example, how blueschist occupies a relatively high-pressure/low-temperature region characteristic of subduction settings, while hornfels occupies a lower-pressure/high-temperature region typical of contact metamorphism. The boundaries are approximate rather than absolute because mineral stability also depends on bulk composition and fluids, but the diagram is a very intuitive example of geological knowledge organized as regions in a multidimensional state space
- BCcampus Physical Geology. BCcampus: Metamorphic Facies and Index Minerals
- U.S. National Park Service. NPS: Metamorphic Rocks
- U.S. Geological Survey. USGS Bulletin 2195 PDF. See especially the pressure-temperature/depth diagram and discussion of regional and contact metamorphism. The USGS version adds more geological context. Along with pressure and temperature, it shows approximate depth, regional versus contact metamorphism, melting, and progressions such as mafic rock → greenschist → amphibolite → granulite and mudstone → slate → phyllite → schist → gneiss. This makes it especially useful for the knowledge-graph discussion because it connects measured conditions not just to categories, but to processes, environments, and transformations.
- My blog, Outside of the Box AI Reasoning with SVMs, August 18, 2025. Used here for the analogy between metamorphic P–T regions and SVM decision regions.
A Graph of How Things Happen
Consider something as familiar as sediment transport. Water is not itself the process. Neither is a river.
Water can be a carrier. A river is a physical system. Fluvial transport is a process. Sediment is the material being moved. Deposition is another process, and the resulting sedimentary structures become evidence of what happened.
A small part of the graph might therefore resemble:
| Subject | Relationship | Object |
|---|---|---|
| Water | acts as carrier in | Fluvial Transport |
| Fluvial Transport | transports | Sediment |
| Fluvial Transport | can produce | Rounded Clasts |
| Fluvial Transport | can produce | Cross-Bedding |
| Deposition | produces | Sedimentary Layer |
That network can connect upward into much larger mechanisms which can roughly follow a sequence like what is shown in Table 12.
| Stage | Process | Description |
|---|---|---|
| 1 | Plate movement | Tectonic plates move and interact, creating stresses and changing crustal structure. |
| 2 | Uplift | Rock is raised to higher elevations, exposing it to surface processes. |
| 3 | Erosion | Exposed rock is broken down and removed by water, wind, ice, or gravity. |
| 4 | Sediment transport | Eroded material is carried away by rivers, glaciers, wind, or other agents. |
| 5 | Deposition | Transported sediment settles and accumulates in a new location. |
| 6 | Burial | Continued accumulation places older sediment under increasing depth, pressure, and temperature. |
| 7 | Metamorphism | Sufficient heat, pressure, and fluids alter the buried rock without completely melting it. |
Other paths intersect it:
- volcanism → ash → deposition
- weathering → dissolved silica → transport by fluids → mineral precipitation
These are not isolated facts. They form a causal-process network.
And the graph can span several very different kinds of knowledge at once, as shown in Table 13.
| Geological subject | What the graph can represent |
|---|---|
| Mafic, felsic and other classifications | What the categories actually mean, including composition and classification rules |
| Basalt, gabbro, granite and rhyolite | Composition, emplacement, cooling rate, texture and relationships among them |
| Rivers, glaciers and wind | Carrier, transport mechanism, material moved and resulting structures |
| Plate tectonics | Subduction, uplift, melting, volcanism and associated downstream processes |
| Sedimentary layers | Composition through time, depositional environments and correlation across locations |
| Volcanic ash layers | Eruptions as time markers connecting geographically separated strata |
| Metamorphism | Pressure, temperature, fluids, protoliths and resulting mineral assemblages |
| Hydrothermal activity | Fluid movement, chemistry, fractures and mineral precipitation |
| Core and outcrop observations | Measurements separated from the interpretations derived from them |
| Geological reconstruction | Multiple competing hypotheses, supporting evidence and contradictory evidence |
Each of these deserves more attention than a single introductory blog can give it. The point is that they can and should belong to the same graph.
The Graph Must Span
That word—span—is important. It would be relatively easy to build individual subject-oriented graphs such as rock ontology, another graph for geological processes, a database of core measurements, and still another model for hypotheses. That misses much of the opportunity. The power comes from traversing them.
An observed mineral assemblage can suggest possible pressure and temperature conditions. Those conditions can point toward a metamorphic process. That process can connect to tectonic environments. Those environments can generate competing hypotheses about the history of a region. A hypothesis can then predict another geological structure that ought to appear elsewhere.
Table 14 lists examples within a sequence of modes of activity that focus on different aspects rock of identification.
| Stage | Step | Description | Geological example |
|---|---|---|---|
| 1 | Observation | Record something directly seen or measured. | A rock contains garnet and biotite. |
| 2 | Classification | Place the observation into a recognized category. | The mineral assemblage is consistent with a particular metamorphic facies. |
| 3 | Property | Identify the relevant characteristics associated with that class. | The facies is associated with a particular range of pressure and temperature. |
| 4 | Mechanism | Connect those properties to the process capable of producing them. | Regional metamorphism under elevated pressure and temperature. |
| 5 | Event | Infer a particular occurrence of that mechanism. | The rock experienced metamorphism during a past tectonic episode. |
| 6 | Hypothesis | Form a broader explanation of what happened. | The region may once have been part of a subduction or mountain-building environment. |
| 7 | Predicted observation | Determine what else should be found if the hypothesis is correct. | Nearby rocks should show compatible mineral assemblages, structures, or ages. |
That is much closer to understanding. It also exposes the difference between:
- Ontology — What kinds of things exist, what properties can they have, and how can those things relate to one another? Ontology describes the kinds of things that exist and the relationships that are generally true of them. Basalt is an igneous rock. Sandstone is a sedimentary rock. Fluvial transport can round clasts.
- Epistemology — How do we know something, what evidence supports it, and how confident should we be that it is true? Epistemology is about evidence, confidence, and justification. These clasts are rounded, the bedding has this geometry, and nearby deposits show the same pattern; therefore an ancient river is a stronger explanation than a dune.
KG technology uses the word ontology somewhat more narrowly for the formal concepts, properties, relationships, and rules used to describe a domain. I describe that in my Semantic Webs of Meaning: What “Ontology” Formally Means, Chapter 3, page 48.
But the underlying distinction remains extremely insightful. Consider some geological examples:
| Statement or question | Ontological / world-model side | Epistemological / evidence side |
|---|---|---|
| Basalt is an igneous rock. | Basalt is classified as a kind of igneous rock. | Which geological classification system establishes that relationship? |
| Basalt is mafic. | Mafic is a compositional category associated with basalt. | What measurements or classification rules caused this particular sample to be classified as mafic? |
| Mafic rocks have relatively lower SiO₂ than felsic rocks. | The graph defines relationships among compositional categories and properties. | Which classification scheme defines the ranges, and what measurement method produced the SiO₂ value? |
| Gabbro tends to have larger crystals than basalt. | Intrusive cooling is slower than typical extrusive cooling, allowing more time for crystals to grow. | What observations support the conclusion that this particular rock cooled slowly underground? |
| Water transports sediment. | Water can act as a carrier in fluvial transport, which can move sediment. | What features of this deposit indicate that flowing water, rather than wind or ice, transported it? |
| This sandstone formed in an ancient river. | Rivers, sediment transport, deposition, channels, and sandstone are related through known geological mechanisms. | Cross-bedding, grain size, clast rounding, channel geometry, fossils, or other observations support the river hypothesis. |
| This ash layer came from Volcano X. | Eruptions produce ash that can be deposited over large areas. | Mineral chemistry, radiometric ages, and trace-element signatures may support correlation with a particular eruption. |
| These two distant layers are the same age. | Geological units can be contemporaneous even when separated geographically. | Shared fossils, ash chemistry, radiometric dates, or other markers support the correlation. |
| This rock experienced metamorphism at particular pressure and temperature conditions. | Minerals have stability ranges related to pressure, temperature, composition, and fluids. | The observed mineral assemblage provides evidence constraining the conditions actually experienced by the rock. |
| Subduction occurred here millions of years ago. | Subduction is a tectonic process capable of producing characteristic structures, metamorphism, magmatism, and volcanism. | The present rocks and structures are traces from which geologists reconstruct that past event. |
The distinction becomes especially clear in the last example.
The graph can contain general knowledge:
- Subduction → can cause → Partial Melting
- Partial Melting → can produce → Magma
- Subduction → can produce → High-Pressure Metamorphism
Those relationships describe how the world is understood to work.
But suppose a geologist claims: Subduction occurred at Location A approximately 150 million years ago.
That is a claim about a particular history. The graph should also be able to answer:
- Which rocks were observed?
- Which minerals were found?
- How were they measured?
- What dates were obtained?
- Which observations support the claim?
- Which observations conflict with it?
- What alternative hypotheses were considered?
- How confident are geologists in the interpretation?
That is the epistemological side of the graph, which also applies to an enterprise.
| Enterprise statement | Ontological / world-model side | Epistemological / evidence side |
|---|---|---|
| A customer can cancel a subscription. | Customer, subscription, and cancellation are defined entities and events and have known relationships. | Which transaction or system event tells us that Customer 123 actually cancelled? |
| A price increase can reduce demand. | Price sensitivity is a possible economic mechanism connecting price to customer behavior. | What evidence indicates that the recent decline in demand was actually caused by price rather than seasonality or competition? |
| Poor service can contribute to churn. | Service quality, dissatisfaction, and churn can participate in a causal mechanism. | Did complaints, response times, outages, or survey scores deteriorate before customers churned? |
| MFA inhibits credential-based intrusion. | Authentication and attack mechanisms can be represented along with controls that interrupt them. | Do security logs show that MFA actually prevented attempted unauthorized access in this incident? |
| Advertising can increase brand awareness. | Exposure, awareness, consideration, and purchase can form a hypothesized causal pathway. | Did measured awareness increase among people who were actually exposed to the campaign? |
| The campaign caused increased sales. | The graph contains mechanisms through which advertising could ultimately influence purchases. | What observations distinguish the campaign effect from seasonality, pricing, competitor actions, or an improving economy? |
| Supplier failure can cause production delays. | Supplier availability, component inventory, production, and delivery are connected through supply-chain mechanisms. | Did the particular production delay actually follow a supplier failure, or was another constraint responsible? |
| Customer churn increased because of a competitor. | Competitive substitution is a possible mechanism. | Are departures concentrated in markets where the competitor launched, and do surveys or win/loss data support that explanation? |
The ontological side therefore contains much more than definitions such as:
- Customer IS-A Party
- Basalt IS-A Igneous Rock.
It can include properties, states, processes, mechanisms, and possible causal relationships:
- Price Increase → can activate → Customer Substitution
- Fluvial Transport → can produce → Rounded Clasts
The epistemological side deals with our claims about particular circumstances:
- Price Increase 2026-07 → caused → Churn Increase 2026-08
- Deposit 47 → was produced by → Fluvial Transport
Those assertions require evidence.
A mature graph should therefore be able to represent not merely a relationship, but the claim about the relationship. The claim becomes something that can itself have evidence, provenance, context, confidence, alternatives, and a history of revision—as shown by Table 17.
| Claim element | Example | What it adds |
|---|---|---|
| Claim | Claim 1827: Price Increase A caused Churn Increase B | Makes the proposed causal relationship an explicit object rather than treating the edge as unquestioned fact. |
| Supported by | Observation 91 | Connects evidence that strengthens the claim. |
| Supported by | Observation 104 | Allows multiple independent observations to contribute to the same interpretation. |
| Contradicted by | Observation 138 | Preserves contrary evidence instead of silently discarding it. |
| Derived using | Analysis 23 | Records the analysis, model, query, experiment, or reasoning process through which the claim was produced. |
| Asserted by | Analyst 12 | Provides provenance: who or what is responsible for the interpretation. |
| Confidence | Moderate | Distinguishes a plausible interpretation from an established conclusion. |
| Competes with | Competitor Hypothesis 7 | Keeps alternative explanations alive rather than prematurely collapsing them into one answer. |
| Applies in context | Product Family A, Enterprise Customers | Prevents a relationship observed in one context from becoming an unjustified universal rule. |
| Evaluated as of | September 2026 | Makes the temporal state of the interpretation explicit so that new evidence can trigger reconsideration. |
This is very different from simply storing Price Increase A → caused → Churn Increase B. That edge makes the interpretation look like part of the world model. Treating it as a claim preserves the epistemology around it: why we believe it, who believes it, where it applies, what contradicts it, what alternatives remain, and whether the evidence is still current. The underlying relationship may eventually become well established enough to contribute to generalized knowledge, but the graph need not pretend that happened before the evidence warrants it.
This ability to treat the claim itself as something that can have provenance, evidence, confidence, and competing explanations is what allows the graph to span ontology and epistemology.
So the distinction can be reduced to two deceptively simple questions:
- Ontology: What is there, and how can it work?
- Epistemology: What do we believe happened here, and why do we believe it?
A useful scientific KG needs both. Without ontology, we have observations without enough structure to explain them. Without epistemology, we risk turning interpretations and hypotheses into facts merely because someone placed an edge in a graph.
The real opportunity comes from connecting the two.
Internationalized Resource Identifiers (IRIs)
An Internationalized Resource Identifier (IRI) gives a thing or concept a globally unambiguous identity (page 96 in Semantic Webs of Meaning). Instead of every KG inventing its own identifier for granite, quartz, or an observation, it can reuse an identifier maintained by an external authority. The human-readable label may vary; the IRI provides the stable identity.
There is no single authoritative IRI vocabulary for everything a geologist might encounter. In practice, an Expert Reasoning Graph could draw from several:
| Source | Best use | Example IRI |
|---|---|---|
| British Geological Survey Rock Classification Scheme | Rock and sediment types; particularly useful when a precise lithologic classification is needed | Granite: http://data.bgs.ac.uk/id/EarthMaterialClass/RockName/GN |
| IUGS CGI / GeoSciML Vocabularies | Geology-specific concepts such as lithology, metamorphic facies, faults, contacts, deformation, geologic-unit types and geological processes | Granite: http://resource.geosciml.org/classifier/cgi/lithology/granite |
| International Commission on Stratigraphy | Geological time: eons, eras, periods, epochs and ages | ICS publishes the International Chronostratigraphic Chart (github repo) itself as an RDF/SKOS knowledge graph. Very interesting to peruse this piece. |
| Wikidata | Broad fallback for minerals, rocks, places, geological features and named entities | Quartz:http://www.wikidata.org/entity/Q43010 |
| QUDT | Units and quantities used in geological measurements | http://qudt.org/vocab/unit/MegaPA |
The graph does not have to obtain all of its identifiers from the same vocabulary. The point is to reuse a well-established identifier when one exists rather than create another local name for the same concept.
Not everything should have an external IRI. A particular outcrop, observation, hypothesis, inferred event, or piece of evidence may exist only within the ERG and therefore require its own identifier. External IRIs primarily anchor the local reasoning graph to meanings shared with the outside world.
An Enterprise Has Sediments Too
Now replace geology with an enterprise. An enterprise also accumulates traces of its history. Table 19 lists a few examples.
| Trace | Description | Example |
|---|---|---|
| Orders | Records of customer purchases and demand. | A customer orders 12 units of Product A on October 3. |
| Clicks | Digital interactions showing what users viewed or selected. | A visitor clicks a pricing page, then a product comparison page. |
| Payments | Records of money received, attempted, delayed, or refunded. | A subscription payment fails twice before succeeding. |
| Shipments | Records of products leaving facilities and moving toward customers. | An order ships two days late from the western distribution center. |
| Complaints | Explicit signals of dissatisfaction or problems. | Several customers report the same defect after a product release. |
| Logins | Records of access to applications or systems. | An employee account logs in from an unfamiliar location at 2:00 a.m. |
| Inventory levels | Snapshots of how much product or material is available at different times and locations. | Inventory for a popular item falls below safety stock for three days. |
| Advertising impressions | Records of when advertisements were displayed to potential customers. | A campaign delivers 4 million impressions to a target segment. |
| Renewals | Records showing that customers continued a contract, subscription, or service relationship. | A customer renews an annual software subscription for another year. |
| Cancellations | Records showing that a customer ended or reduced a relationship. | A customer cancels shortly after several unresolved support incidents. |
| Financial results | Aggregated measures of business performance produced by many underlying activities. | Quarterly revenue falls 8% while gross margin remains stable. |
Traditional BI is excellent at describing those traces. For example: Revenue declined 8 percent, Customer churn increased, Conversion dropped, Inventory turns slowed.
Those are merely observations, not explanations.
Suppose a major customer segment begins to churn (that is, customers begin leaving, cancelling, or failing to renew at an unusually high rate). There could be several working hypotheses, each implying different evidence:
| Hypothesis | Possible explanation | Evidence we might expect |
|---|---|---|
| H1 | A price increase caused the churn. | Churn rises disproportionately among price-sensitive customers or in products affected by the increase. |
| H2 | Service quality deteriorated. | Support incidents, complaints, outages, or resolution times worsen before churn increases. |
| H3 | A competitor introduced a better offering. | Churn clusters in markets or customer segments where that competitor is strongest, especially after its launch. |
These hypotheses don’t need to be mutually exclusive. A price increase may be a perfectly viable explanation even if only some customers are sensitive to price. Other customers may tolerate the increase unless it is combined with poor service, a compelling competitive offer, or some other condition. Therefore, we could infer that the customers who churn may consist of subsegments that arrived at the same outcome through different combinations of mechanisms. For the purposes here, we do not need to determine the precise contribution of every factor.
We can, however, examine the histories of the customers who left. What events occurred before churn? What was the last meaningful event before cancellation or non-renewal? A bad support interaction immediately before a customer leaves is an important clue, even if a price increase occurred several weeks earlier. But sequence alone doesn’t tell us the strength of each cause. The support call might have been the final trigger, the price increase an underlying contributor, or one of them might merely have occurred nearby in time.
The problem, then, is not simply to find the event before churn. It is to reconstruct plausible mechanisms, recognize that different customers may follow different causal paths, and determine what additional evidence would strengthen or weaken each explanation.
The enterprise analyst is now doing something remarkably similar to the geologist, shifting the question from:
What happened?
to:
What mechanisms could have produced what happened, and what should I look at next to distinguish among them?
Two Enterprise Examples – Risk and Advertising
Some business phenomena are easy to measure but hard to explain.
Customer churn we just discussed is one example. We can measure that customers left, but determining why they left may require reconstructing a combination of price changes, service interactions, competitor activity, product problems, timing, and differences among customer subsegments. Employee churn has the same problem: compensation, management, workload, career opportunity, culture, location, personal circumstances, and outside offers can all contribute in different combinations.
This is the kind of problem an ERG is meant to support. The interesting question isn’t simply what happened, but what mechanisms could have produced what happened, what evidence each mechanism predicts, and what evidence should be sought next.
Table 21 lists examples of problems faced in an enterprise.
| Phenomenon | Observable outcome | Why explanation is difficult |
|---|---|---|
| Customer churn | Customers cancel, fail to renew, or reduce business | Different customers may leave for different combinations of price, service, competition, product fit, or other causes |
| Employee churn | Employees resign or fail to stay | Compensation, managers, workload, advancement, culture, geography, and outside opportunities interact differently across people |
| Security incident | Data is accessed, altered, or exfiltrated | The same outcome can result from stolen credentials, insider action, software vulnerabilities, social engineering, or combinations of them |
| Operational failure | A process misses SLA, quality, or throughput targets | Equipment, staffing, supply, software, policy, and upstream failures may interact |
| Revenue decline | Sales or revenue fall | Demand, price, competition, channel, product mix, seasonality, and customer behavior can all contribute |
| Quality problem | Defects or complaints rise | Materials, equipment, process variation, operator behavior, suppliers, and environmental conditions may combine |
| Fraud | Suspicious or unauthorized transactions occur | Individual events may look legitimate; explanation often requires reconstructing patterns across identities, accounts, locations, and time |
| Advertising response | Awareness, visits, purchases, or repeat purchases change | Exposure does not directly reveal persuasion; multiple intermediate mechanisms and outside influences affect the eventual outcome |
| Risk realization | An undesirable event or state occurs | The visible failure is often the endpoint of a longer chain of vulnerabilities, conditions, decisions, and triggering events |
Among the items listed in Table 21, I chose risk and advertising campaigns because they approach the same reasoning problem from opposite directions:
- Risk starts with experiencing an undesirable outcome or possible failure and asks what mechanisms could lead to it. It is naturally suited to reconstructing failure pathways, generalizing them across cases, and then using those mechanisms to anticipate future incidents.
- Advertising starts with an intended intervention and asks what mechanisms must occur for the desired outcome to result. A campaign is effectively a theory of change: exposure should affect awareness, consideration, behavior, and ultimately purchase.
So one looks largely backward and forward from failure, while the other looks forward from deliberate intervention.
Together they show that the same underlying structure can support both:
- Why did this happen?
- What would have to happen for this to work?
Risks Are Theories of Failure
This topic extends the Risk Knowledge Graph described in Chapter 9 of Semantic Webs of Meaning. In the Risk Knowledge Graph, a risk can be represented as something more than just an item in a catalog of known risks. It can be connected to the people, systems, events, conditions, and intermediate outcomes through which the risk can emerge.
But reaching further: where does our conception of a risk come from in the first place?
Usually, it begins with cases. A detective does not begin by knowing exactly what happened.
There is a particular incident and a collection of traces: a broken window, a missing object, a financial transaction, a witness statement, a login record.
The detective develops multiple hypotheses. One hypothesis may explain some evidence but not other evidence. Another may predict something that can be checked. As evidence accumulates, the investigator develops a theory of the particular case.
At first, this is only an explanation of one event. But after years in the business, detectives also encounter many cases. Eventually a case begins to look familiar. A particular combination of entry method, target selection, timing, behavior, and outcome resembles previous incidents. What looked like a collection of isolated cases becomes a recognizable pattern.
The same transition occurs in geology. One deposit can be reconstructed as the result of a particular sequence of events. But after geologists encounter similar combinations of grain size, structures, mineralogy, geometry, and surrounding formations in many locations, they recognize the operation of a recurring geological process.
The reasoning moves from the particular toward the general.
| Stage | Detective example | Geological example | Enterprise-risk example |
|---|---|---|---|
| Case | A particular burglary occurred. | A particular sedimentary deposit is observed. | A particular customer database was breached. |
| Observations | Broken lock, missing property, camera footage | Grain size, cross-bedding, rounded clasts | Login records, privilege changes, data transfers |
| Competing hypotheses | Insider, opportunistic thief, organized group | River, beach, windblown dune | Stolen credential, insider access, software exploit |
| Case theory | The evidence best supports a particular sequence of entry and theft. | The evidence best supports deposition by an ancient river. | The evidence supports credential theft followed by lateral movement and exfiltration. |
| Pattern across cases | Similar burglaries repeatedly use the same method. | Similar deposits repeatedly exhibit the same combination of features. | Other breaches show the same sequence of credential theft, privilege escalation, and exfiltration. |
| Generalized mechanism | A recognizable burglary method or modus operandi | A known depositional process | A known attack pathway |
| Risk class | This kind of burglary can now be recognized elsewhere. | Similar evidence can identify fluvial deposits elsewhere. | Credential compromise becomes a recognized enterprise risk with known indicators and controls. |
The key transition is from instance to class.
A risk such as data exfiltration is a useful category (label, symbol), but the category becomes much more powerful when the graph contains the mechanisms through which instances of that risk actually occur. A reconstructed incident might contain a path such as the stages in Table 23.
| Stage | Particular incident | Generalized mechanism |
|---|---|---|
| Initial contact | Phishing Message 482 was received | Phishing Message |
| Credential compromise | Credential Capture 391 occurred | Credential Capture |
| Initial access | Unauthorized Login 882 occurred | Unauthorized Authentication |
| Increased capability | Privilege Escalation 73 occurred | Privilege Escalation |
| Movement | Lateral Movement 51 occurred | Lateral Movement |
| Target access | Sensitive-Data Access 27 occurred | Sensitive-Data Access |
| Outcome | Exfiltration 19 occurred | Data Exfiltration |
Each event and each connection between events is a claim about what happened in that particular case and should retain its supporting evidence, contradictions, provenance, and confidence.
Across many reconstructed incidents, however, portions of these paths may begin to recur. The particulars can then be abstracted into more general event types and causal relationships:
| Level | Question answered | Nature of the knowledge |
|---|---|---|
| Instance | What happened in this case? | Epistemic claims about particular events, supported by particular evidence |
| Recurring pattern | What seems to happen repeatedly across cases? | An emerging pattern supported by multiple case histories |
| Class / mechanism | How can this kind of failure happen? | Generalized knowledge about a reusable causal pathway |
| Prediction / intervention | Where might it happen again, and where can we interrupt it? | Application of the generalized mechanism to new circumstances |
A sequence reconstructed in one incident is initially an explanation of that particular case. When similar sequences recur across a significant number of incidents, recurring portions of those paths can be generalized into a risk mechanism.
The graph can therefore represent both levels at once:
| Level | What the graph represents | Example |
|---|---|---|
| Particular incident | A reconstructed theory of what happened in one specific case. These claims should remain connected to the observations, evidence, contradictions, provenance, and confidence that support them. | Incident 174 → involved → Credential Theft 391 Credential Theft 391 → enabled → Unauthorized Login 882 Unauthorized Login 882 → preceded → Privilege Escalation 73 |
| Generalized mechanism | A reusable causal pathway abstracted from recurring structures found across multiple incidents. It describes what can happen rather than asserting what happened in any particular case. | Credential Theft → can enable → Unauthorized Authentication Unauthorized Authentication → can enable → Privilege Escalation Privilege Escalation → can enable → Data Exfiltration |
The generalized relationships can be learned from many cases, expert knowledge, security research, or some combination of them. A single incident may initially appear unusual. A second provides a resemblance. Ten cases expose a pattern. Hundreds of cases may reveal that what had been treated as one risk is actually several mechanisms with different causes, indicators, and controls. So:
- The first graph answers: What happened in this case?
- The second answers: How can this kind of failure happen?
- And once the mechanism is understood, a third question becomes possible: Where can we interrupt it?
Controls can be attached to particular parts of the mechanism:
- MFA → inhibits → Unauthorized Authentication
- Network Segmentation → inhibits → Lateral Movement
- Data Loss Prevention → inhibits → Exfiltration
The risk graph is therefore no longer merely a map from a named risk to an undesirable outcome. It becomes a model of how the risk develops.
That is much closer to what geologists do when they reconstruct geological history from traces. It also means that risks themselves can evolve as knowledge evolves.
The graph can preserve that progression rather than prematurely flattening every case into an existing category. In that sense, risk management resembles scientific investigation, drilling up and down through a hierarchy of levels:
| Stage | Step | Description | Enterprise risk example |
|---|---|---|---|
| 1 | Observe individual cases | Examine particular incidents and the traces they leave behind. | A customer database is breached. |
| 2 | Generate hypotheses | Develop competing explanations for how the incident occurred. | Stolen credentials, insider access, or a software exploit. |
| 3 | Reconstruct mechanisms | Determine the sequence of events and processes that best explains the case. | Credential theft → unauthorized login → privilege escalation → exfiltration. |
| 4 | Compare cases | Look across other incidents for similarities and differences. | Several breaches show the same sequence of credential compromise and lateral movement. |
| 5 | Recognize recurring patterns | Identify combinations of events and conditions that repeatedly appear together. | Credential-based intrusion repeatedly precedes privilege escalation and data access. |
| 6 | Generalize the mechanism | Convert the repeated pattern into a reusable model of how this kind of failure can occur. | Credential compromise becomes a recognized attack pathway. |
| 7 | Recognize and anticipate future cases | Use the generalized mechanism to identify new incidents earlier or estimate where the same failure could occur again. | Detect similar login behavior in another system and intervene before exfiltration occurs. |
Once a recurring mechanism has been identified, the enterprise can work in both directions.
Looking backward, it can use the mechanism for forensics:
Which pathway best explains what already happened?
Looking forward, it can use the same mechanism for risk analysis:
Given the current conditions, which known pathways could produce a future failure?
And during an unfolding event, it can use the mechanism for diagnosis:
If this hypothesis is correct, what should we observe next?
A risk, then, can be thought of as a theory of failure generalized from possible or observed cases.
The Risk Knowledge Graph describes not merely that the risk exists, but the mechanism by which the enterprise can move from an acceptable state to an undesirable one.
An Advertising Campaign Is a Theory of Change
The same method works in the opposite direction. Suppose a company is about to spend tens of millions of dollars on an advertising campaign. Behind the campaign is an implicit causal theory crafted by marketing folks. Rather than representing it simply as:
Advertising → exposure → awareness → consideration → visit → evaluation → purchase → repeat purchase
the graph can make each proposed transition explicit:
| Stage | Hypothesized transition | Evidence we might expect | What we learn if the expected change does not appear |
|---|---|---|---|
| Campaign delivery | Advertising → Exposure | Reach, impressions, frequency, target-audience delivery | The campaign may not be reaching the intended audience sufficiently. |
| Attention / memory | Exposure → Brand Awareness | Aided or unaided recall, awareness studies, recognition | Delivery occurred, but the advertising may not be creating a memorable impression. |
| Persuasion | Awareness → Consideration | Consideration measures, preference, branded search, expressed interest | People know the brand but are not sufficiently persuaded to consider it. |
| Action | Consideration → Store or Website Visit | Branded searches, site visits, store traffic, dealer inquiries | Interest may exist without enough motivation or opportunity to investigate further. |
| Evaluation | Visit → Evaluation | Product-page activity, comparisons, configurator use, demos, inquiries | People arrive but may not find the product, offer, or experience compelling enough to evaluate seriously. |
| Conversion | Evaluation → Purchase | Orders, conversion rate, sales among exposed or engaged populations | Evaluation is occurring but something may be preventing purchase—price, availability, product fit, friction, or another factor. |
| Retention | Purchase → Repeat Purchase | Repurchase, renewal, retention, subsequent usage | The campaign may acquire customers without creating durable customer value. |
Each arrow is therefore a hypothesis about a mechanism, and each mechanism predicts traces that should appear if it is operating.
A mechanism-oriented graph does more than record whether an initiative ultimately succeeded or failed. It preserves the intermediate steps that were expected to connect an action to an outcome, making it possible to see where the theory held, where it broke down, and what evidence should be examined next.
Consider an advertising campaign intended to increase revenue through a sequence such as:
Exposure → Awareness → Consideration → Purchase → Revenue
If awareness rises sharply but consideration does not, the result is more informative than simply saying that the campaign produced disappointing ROI. It suggests that one part of the proposed mechanism worked: the campaign created awareness. The failure appears later in the pathway, somewhere between awareness and consideration.
That leads to a very different investigation from one in which the intended audience was never exposed to the campaign at all. The first case raises questions about the message, product relevance, competitive alternatives, or the transition from awareness to consideration. The second raises questions about targeting, media placement, delivery, or reach.
This illustrates an important advantage of representing the mechanism itself. The ad campaign’s return on investment summarizes the endpoint, but it does not explain the pathway. Two campaigns can produce the same disappointing ROI while failing for entirely different reasons. A mechanism-oriented graph preserves those differences by retaining the intermediate states and relationships through which the outcome was expected to emerge.
The same mechanism-oriented reasoning applies well beyond advertising. In each domain, the graph preserves the intermediate conditions and causal steps that connect an initiating event or decision to an eventual outcome, so that success or failure can be traced to a particular part of the pathway rather than judged only at the endpoint.
Table 28 lists a few examples of how that “mechanism-oriented” concept works in other domains.
| Enterprise subject | Mechanism-oriented question |
|---|---|
| Identified risk | Through which mechanisms can this risk become an actual loss? |
| Security | Which attack paths remain viable, and which controls interrupt them? |
| Advertising campaign | Through which intermediate states should advertising eventually create revenue? |
| Customer churn | Which competing mechanisms could explain the observed departures? |
| Supply chain | How does disruption propagate through inventory, production, and customers? |
| Pricing | Through which customer behaviors does a price change affect volume and margin? |
| Fraud | What sequence of events and conditions makes a fraudulent transaction possible? |
| Product strategy | What mechanisms are expected to turn a new capability into customer value? |
These subjects are usually modeled and analyzed separately. But from the perspective of a sufficiently broad causal knowledge graph, they share the same underlying problem: What sequence of conditions, events, and transitions connects an initial state to an eventual outcome?
A Method for Building the Graph
A first version does not require solving causality mathematically throughout the enterprise. It requires being disciplined about what is being represented. The graph should distinguish at least:
| Graph element | What it represents | Examples |
|---|---|---|
| Entities | The things that participate in enterprise processes. | Customers, suppliers, products, employees, systems, warehouses |
| States | Conditions an entity or system can be in at a particular time. | Low inventory, high demand, compromised credentials, customer dissatisfaction |
| Events | Things that happen and potentially change the state of the system. | Purchase, login, campaign launch, price increase, shipment, service outage |
| Mechanisms | Processes through which one state or event can produce another. | Substitution, depletion, authentication, persuasion, contagion, inventory consumption |
| Observations | Recorded evidence about the enterprise and its behavior. | Metrics, transactions, sensor readings, logs, survey responses, measurements |
| Hypotheses | Possible explanations for observations or proposed causal paths. | Price increase caused churn; campaign increased awareness; credential theft enabled intrusion |
| Interventions and controls | Actions intended to activate, inhibit, interrupt, or redirect mechanisms. | Advertising campaign, discount, MFA, safety stock, network segmentation, second-source supplier |
Then relationships carry verbs such as:
| Relationship | Meaning | Example |
|---|---|---|
| causes | Produces or directly contributes to an outcome. | Price Increase → causes → Lower Demand |
| enables | Creates conditions that make another event or process possible. | Credential Theft → enables → Unauthorized Login |
| inhibits | Reduces, blocks, or suppresses a process or outcome. | MFA → inhibits → Unauthorized Authentication |
| transports | Moves material, information, or something else from one place or state to another. | Fluvial Transport → transports → Sediment |
| transforms | Changes one thing or state into another. | Metamorphism → transforms → Protolith into Metamorphic Rock |
| predicts | Implies that another observation or outcome should be expected if a hypothesis is correct. | River-Deposit Hypothesis → predicts → Cross-Bedding |
| supports | Provides evidence in favor of a hypothesis, claim, or interpretation. | Rounded Clasts → supports → Fluvial-Transport Hypothesis |
| contradicts | Provides evidence against a hypothesis, claim, or interpretation. | Marine Fossils → contradicts → Desert-Dune Hypothesis |
| mitigates | Reduces the probability, severity, or consequences of a risk. | Safety Stock → mitigates → Supplier-Disruption Risk |
| requires | Indicates that something must be present or occur for another thing to happen. | Combustion → requires → Oxygen |
| precedes | Occurs before another event in time without necessarily implying causation. | Support Complaints → precedes → Customer Churn |
Takeaways:
- An observation need not be confused with an explanation.
- A hypothesis need not be confused with established knowledge.
- A correlation need not automatically become a causal relationship.
- And several hypotheses can coexist while the evidence develops.
The graph therefore becomes not simply a representation of what the enterprise knows, but also of what it thinks might be true and why.
The Graph and the Analytical Data Need Each Other
None of this means stuffing every measurement into a KG.
Geology makes that obvious. Millions or billions of spectral readings, elemental measurements, depths and geographic observations belong in analytical systems designed to work efficiently across large quantities of numeric data. Enterprise transactions belong there too.
This is where a high-performance semantic layer such as Kyvos becomes important. The analytical evidence may have to be retrieved from enormous volumes of fine-grained data at interactive speed and under enterprise-scale concurrency. The semantic layer does more than provide fast access to that underlying data. It turns the data into consistently defined information: measures, ratios, distributions, sequences, trends, cohorts, comparisons and other analytical results. Those results can become evidence for—or against—the hypotheses represented in the graph.
The causal graph might contain a hypothesis such as:
Price Increase → caused → Increased Churn
That hypothesis suggests what we should expect to observe. The semantic layer can produce the relevant information:
| Question suggested by the hypothesis | Information supplied through the semantic layer |
|---|---|
| Did churn increase after the price change? | Churn rate as a time series before and after the change |
| Were affected products hit harder? | Churn by product and pricing change |
| Were price-sensitive customers affected disproportionately? | Churn by customer segment |
| Was this simply a company-wide trend? | Comparison with unaffected products or populations |
| Did another change occur at the same time? | Related service, usage, support, competitive or operational measures over the same periods |
The graph provides the reason for asking these questions. The semantic layer provides the information with which to investigate them.
The relationship works in the other direction as well. An unexpected series, change point, cluster, correlation or outlier produced through analytics can become the observation that starts a new abductive cycle. The analyst or AI asks what mechanisms might explain it, generates hypotheses in the graph, and then returns to the semantic layer looking for information that would distinguish among them.
The geological example is much the same. The graph may predict that two geographically separated formations were deposited during the same period. An analytical system can compare sequences of mineral composition, fossil occurrence, isotope measurements or other properties across depth and location. A matching pattern does not by itself prove the geological interpretation, but it provides evidence that can strengthen or weaken it.
The semantic layer does not magically establish causality. It provides governed, consistently defined information from the observations against which causal hypotheses can be tested.
That also gives the two technologies complementary roles:
- Knowledge graph: What mechanisms are possible? What hypotheses are we considering? What evidence should exist if each is true?”
- Semantic layer: What does the evidence actually look like across the available data?
Together they support a cycle:
| Stage | Step | Description | Enterprise example |
|---|---|---|---|
| 1 | Observation | Notice a pattern, anomaly, or result that needs explanation. | Customer churn rises sharply after a pricing change. |
| 2 | Hypothesis | Propose one or more mechanisms that could explain the observation. | The price increase caused more price-sensitive customers to leave. |
| 3 | Predicted evidence | Identify what should be observable if the hypothesis is correct. | Churn should rise more among affected products and price-sensitive segments. |
| 4 | Semantic-layer analysis | Use governed measures, dimensions, cohorts, time series, and comparisons to examine the predicted evidence. | Compare churn by segment, product, price change, and time period. |
| 5 | Support or contradiction | Determine whether the analytical evidence strengthens or weakens the hypothesis. | Price-sensitive segments show much larger churn increases than unaffected groups. |
| 6 | Revised hypothesis | Refine, combine, or reject explanations based on the evidence. | Price contributed to churn, but service deterioration also appears to have played a role. |
And because the information is produced through a common semantic layer, the hypothesis does not have to be tested against a collection of independently defined numbers. Customer, churn, revenue, campaign exposure, inventory, time period, and other business concepts retain their governed meanings as the investigation moves through different analyses.
This becomes especially important when the evidence is not one number but a shape: a sequence over time, a change in composition, a difference between cohorts, a geographical pattern, or several measures moving together. Those patterns can be the enterprise equivalent of sedimentary layers.
The KG gives those patterns explanatory context. The semantic layer makes them measurable. That final relationship is where this becomes especially interesting for AI.
An Expert Reasoning Graph may also be considerably harder to construct than an ordinary ontology or KG. Much conventional knowledge representation has the benefit of already-serialized knowledge: books, articles, documentation, policies, specifications, databases, and other explicit sources. Expert reasoning often does not. Some of the most valuable material may have become tacit through years of experience: the clue that catches someone’s attention, the possibility that “doesn’t feel right,” or the strangely specific question an expert knows to ask next.
That makes construction of the graph itself an expert-reasoning problem.
This may be one of the places where LLMs can provide unusual leverage. The LLM need not invent the expertise. It can help elicit and structure it: walk through difficult real cases with an expert, ask what they noticed, what alternatives they considered, what they expected to find, what would have changed their mind, and what they examined next; then turn those conversations into candidate graph structures for the expert to validate and revise. CTA techniques such as the Critical Decision Method provide obvious guidance for such a process.
Building an Expert Reasoning Graph may remain extremely difficult. But this is exactly the kind of problem where AI may move this task from excruciatingly difficult toward merely difficult and, most importantly, feasible.
Appendix C – From Brain Dump to Expert Reasoning Graph takes this idea further by showing what the collaboration between an SME and an LLM might actually look like. The expert does not need to write a polished treatise on everything they know. They can begin with cases, stories, exceptions, hunches, and even a rough brain dump; the LLM can help expose the implicit context, mechanisms, alternatives, and evidence, then turn that material into a candidate graph for the expert to correct and refine. In that sense, building an ERG starts to resemble writing a serious book about one’s expertise—but with much of the elicitation, organization, and formalization work shared with the AI, and with a graph rather than a book as the resulting artifact.
Conclusion
Geology, history, and detective work all begin with an uncomfortable fact. That is, the events of interest have already happened. What remains are traces.
The investigator must reconstruct what happened, consider more than one possible explanation, determine what evidence each explanation predicts, and then look deliberately for the observations that can distinguish among them.
Enterprises face much the same problem. Orders, clicks, complaints, security logs, inventory movements, campaign results, cancellations, and financial measures are traces of underlying processes. BI can tell us a great deal about those traces. But describing what happened is different from explaining the mechanisms that produced it.
An Expert Reasoning Graph, connected to the enterprise’s broader causal knowledge graph, provides a place to represent mechanisms, competing hypotheses, predicted evidence, supporting and contradictory observations, risks, controls, and interventions. The semantic layer complements it by turning enormous volumes of underlying data into consistently defined information—series, comparisons, cohorts, ratios, distributions, and other analytical evidence with which those hypotheses can be examined.
The same underlying graph can then support several kinds of enterprise reasoning:
- Forensics: What mechanism best explains what has already happened?
- Risk: What known mechanisms could carry the enterprise toward an undesirable state?
- Strategy: What mechanisms can we deliberately activate, strengthen, interrupt, or redirect to reach a desired state?
These are usually treated as different disciplines. At another level, they are different directions through the same network of entities, states, events, mechanisms, observations, and evidence.
Individual cases can also improve that network. A failure initially appears as a one-off incident. Similar cases reveal a pattern. The pattern suggests a generalized mechanism. That mechanism can then help recognize new cases, predict vulnerabilities, and identify where intervention may be effective. New evidence, in turn, modifies the model.
The result is not simply a larger KG or a smarter collection of dashboards. It is a way of connecting observation with explanation.
Geologists learned to reconstruct worlds that no longer exist from the fragments left behind. Enterprises already possess enormous collections of their own fragments. A graph of mechanisms, hypotheses, and evidence—connected to the analytical information of the semantic layer—may offer a way to reason about those fragments much more scientifically.


