
TL;DR
When I wrote much of Enterprise Intelligence in 2023, the rapid rise of AI made it clear to me that enterprises needed to start planning for something beyond dashboards and reports: an architecture capable of accumulating and using intelligence across the business. That opened the door wider for the Insight Space Graph (ISG), which remembers observations discovered through ordinary BI work, and the Tuple Correlation Web (TCW), which connects observations across domains.
From the beginning, that architecture depended on a high-performance, enterprise-wide semantic layer. A narrow domain cube would not be enough. The ISG needs a broad, governed analytical surface spanning Finance, Sales, Operations, Supply Chain, Marketing, and other domains so that observations can be connected and revisited across the enterprise.
This article focuses on a consequence of that original design that I had not fully addressed outside of the book: remembered observations age. Some will need to be refreshed occasionally; others may need to be re-observed frequently; and at times large portions of the ISG may need another look. That makes semantic-layer performance more than a matter of dashboard responsiveness. It is what makes repeated re-observation economically practical.
The original inspiration, therefore, still holds. That is, Enterprise Intelligence needs both a memory of what the enterprise has learned and a fast, wide source from which it can look again when that remembered knowledge may no longer describe reality.
Notes:
- This article is:
- Related to my 2024 book, Enterprise Intelligence. This article precedes a “refresh” of the book’s accompanying GitHub repository, which should be rolled out by the end of 2026.
- A follow-up to my September 30 article, Reaching from the Realm of Information into the Realm of Knowledge. In that post, I focused heavily on the role of the semantic layer—particularly a high-performance semantic layer such as Kyvos—as the governed Information Space from which we can construct and connect higher-level knowledge.
- Focuses on a problem I punted: information changes, and therefore knowledge derived from that information becomes stale.
- A disclosure: I work for Kyvos as a Principal Solutions Architect. I have also spent much of my career (mostly the last 25 years) developing and writing about the ideas discussed here, including years before I joined Kyvos. I am not presenting Kyvos as a disinterested observer. But I genuinely believe in its pre-aggregated semantic layer, and now its movement toward explicit knowledge.
- Some of the figures are very busy. For a full view, click on the Figure, and hit the Browser’s back arrow to return to this article.
Introduction
I have written about Enterprise Intelligence, the Insight Space Graph (ISG), and the Tuple Correlation Web (TCW) in blogs since publishing Enterprise Intelligence in 2024. The collective word count of those blogs probably exceeds that of the book. This isn’t because I keep changing my mind about the architecture. It’s that I keep finding implications of the same basic idea.
Note: If you aren’t familiar with my book, Enterprise Intelligence, please read the TL;DR.
That basic idea starts with the dozens to hundreds of analysts across an enterprise who spend their days trying to solve problems. Much of that work involves ordinary Business Intelligence—slicing and dicing, filtering, drilling up and down, comparing periods, changing perspectives, and asking another question when the first one doesn’t explain what they are seeing.
Those queries are more than requests for charts. They are little acts of investigation. The ISG is intended to retain some of what those investigations uncover: observations about spikes, trends, anomalies, correlations, clusters, and other features encountered while analysts explore the enterprise. Just as importantly, the ISG can retain enough information about how an observation was obtained to return to approximately the same analytical viewpoint later.
That capability becomes important once we recognize that an insight is not permanently attached to the state of the world that produced it. If the ISG remembers not only an observation but also the query—SQL, DAX, MDX, or another query language—that produced it, then remembered knowledge does not have to become detached from the information on which it was based. When circumstances warrant it, the system can return to the semantic layer, obtain another observation, and determine whether what it previously believed is still sufficiently true to act upon.
When a BI query is returned (as a dataframe, data set, etc.), the Insight Functions Array (IFA) can examine the same data for potentially salient features—spikes, drops, trends, intersections, unusual volatility, outliers, correlations, clusters, and so forth. Those observations can be retained whether the analyst noticed them, noticed but ignored them, or wasn’t looking for them in the first place.
The TCW extends that idea across domains. Analysts in Finance, Operations, Sales, Marketing, Supply Chain, and elsewhere generally work on their own problems. But their observations share dimensions, particularly the ubiquitous dimension of time. Things happening in one domain of an enterprise may provide evidence or clues for understanding something happening in another domain.
The analysts explore. The system notices, remembers, and connects what their exploration encountered. The insights and correlations of the ISG and TCW, respectively, become clues for abductive reasoning—the superior class of reasoning epitomized by Sherlock Holmes and the TV character, MacGyver.
The insights and correlations of the ISG and TCW, respectively, become clues for abductive reasoning
And underneath all of it is a high-performance semantic layer, which enables this process:
- Analysts are already exploring the enterprise. Across Finance, Sales, Marketing, Operations, Supply Chain, and other domains, analysts spend their days trying to solve problems through ordinary BI work: slicing, dicing, filtering, drilling, comparing periods, changing dimensions, and asking follow-up questions.
- Every BI query is an observation opportunity. A query is more than a request for a chart. It represents a particular look at the enterprise: a set of measures, dimensions, filters, grain, and time range selected because someone was investigating something.
- The same returned data can be examined automatically. When the BI query returns a result, it can also be passed through an Insight Function Array (IFA) containing detectors for spikes, drops, trends, intersections, volatility, rankings, outliers, correlations, clusters, and other potentially meaningful patterns.
- False positive: the analyst sees a real insight but considers it irrelevant locally; the IFA retains it because it may matter elsewhere.
- False negative: a relevant insight is present but the analyst fails to notice it; the IFA can detect and retain it.
- True negative: even the absence of an expected problem can become evidence for later abductive reasoning.
- The system can notice things the analyst did not. The analyst may see an anomaly and care about it, see it and decide it is irrelevant, or fail to notice it altogether. The IFA can still record potentially salient observations independently of the analyst’s immediate purpose.
- Salient observations are retained in the ISG. Instead of allowing useful observations to disappear when the visualization is closed, the ISG preserves them as part of the enterprise’s accumulated analytical memory.
- The system remembers how the observation was produced. The ISG can retain the query definition—the analytical coordinates needed to reproduce the observation. That is important because an insight should not merely say what appeared to be true once; the system should know how to return to the source and look again (re-observation).
- Thousands of independent investigations gradually accumulate. The architecture does not require analysts to coordinate with one another or adopt a new way of working. Their normal BI activity continuously contributes observations to a larger shared intelligence structure.
- The TCW connects work across domains. Finance may be investigating margin while Operations investigates delivery delays and Marketing investigates campaign performance. The TCW looks for relationships among observations that originated in otherwise separate investigations.
- Time provides a ubiquitous dimension for integration. Almost every business observation occurs over some period. That makes time a natural bridge across domains. If apparently unrelated changes occur during overlapping periods, the TCW has a reason to investigate whether the relationship is meaningful.
- Correlations are hints, not conclusions. The TCW is not intended to declare causation. It identifies relationships worth further investigation, giving analysts, rules, machine-learning models, and AI systems additional places to look.
- The semantic layer supplies governed meaning. Measures such as revenue, margin, units, customer count, or inventory must mean the same thing every time they are queried. A governed semantic layer provides that consistency while allowing the intelligence structures above it to work with business concepts rather than raw tables.
- Performance is foundational, not cosmetic. This architecture can generate enormous numbers of analytical requests: analyst queries, IFA analysis, TCW probing, validation queries, and later refreshes of previously stored observations. A very fast semantic layer such as Kyvos makes repeated multidimensional exploration practical at enterprise scale.
- The result is not another dashboard. The dashboard serves the analyst’s current question. The ISG and TCW attempt to preserve and integrate some of the intelligence generated during the process of answering that question.
- And now there is one more requirement: the system must be able to re-observe (look again). Stored observations age. Conditions change. What appeared important yesterday may disappear, strengthen, or reverse. If the system remembers how an observation was obtained, it can rerun the query and refresh its view of reality.
I have written extensively about all of that. What I want to focus on in this blog is the last bullet (14). Strictly speaking, all information is stale to some degree—because the world is a complex system in constant change.
BI has dealt with this problem of constant change for decades, although we usually treated it as a question of data freshness/currency, processing, caching, or performance. We generally assumed that once the data presented to us was sufficiently current, we could proceed with the analysis. Table 1 lists a few major BI innovations that deal with stale data.
| BI concept | What we have traditionally been deciding | Concrete BI example |
|---|---|---|
| LastNonEmpty | There is no newer value at this coordinate, so continue using the most recent one available. | In SSAS Multidimensional, LastNonEmpty is a semi-additive aggregation behavior: evaluate the measure using the last time member that contains data. This is almost a formal declaration that an older observation may stand in for a newer missing one. |
| Scheduled processing | The source has changed. When should the analytical model be brought up to date? | SSAS supports processing operations such as ProcessFull, while Kyvos supports scheduled Full and Incremental semantic-model processing. Kyvos schedules can run at configured intervals ranging from minutes to monthly schedules. |
| Incremental processing | Most historical data has not changed, so refresh only the portion likely to be different. | SSAS provides ProcessAdd for incremental updates to partitions. Kyvos likewise supports Incremental Data processing, including processing newly arrived data rather than rebuilding the entire semantic model. |
| Late-arriving facts and dimension changes | Even our representation of the past may change when new facts arrive or their context is revised. | A previously processed monthly partition may need to be replaced or reprocessed when late facts arrive. Kyvos incremental processing includes options for updating new data and replacing previously processed partitions. |
| Caching | We already computed this answer. Has anything changed that makes the cached answer obsolete? | SSAS and other OLAP engines cache query results internally. Kyvos exposes cache strategies and cache-processing jobs. The deeper problem is not storing the cached answer, but knowing when its assumptions have become obsolete. |
| Real-time BI | Waiting for the next analytical-model refresh is unacceptable, so query closer to the source receiving the changing data. | SSAS Real-Time HOLAP keeps detail relational and aggregations multidimensional; after source changes, queries temporarily use ROLAP until the aggregations are refreshed. Power BI Hybrid tables carry forward a related pattern by combining imported history with DirectQuery for the newest data. |
| Partitioning | Different regions of the data have different processing and currency requirements. | In SSAS, a measure group can be divided into partitions, each with its own storage and processing characteristics. This makes it possible, for example, to treat current-period data differently from historical data. |
| Pre-aggregation | Repeatedly calculating the same multidimensional answers is expensive, so materialize useful aggregations ahead of time. | SSAS aggregation designs and Kyvos multidimensional semantic models precompute useful aggregate structures. Kyvos’ MDM approach is particularly relevant to re-observation because it can make another slice-and-dice query inexpensive even across enormous fact volumes. |
| Hybrid materialization | Some analytical paths deserve pre-aggregation while others can remain relational. | Kyvos Hybrid Multidimensional Models can serve materialized dimensions or measures through Kyvos Query Engines while delegating queries involving non-materialized elements to an external SQL engine. |
| Time-window calculations | The “current” view often means changing the analytical time window rather than obtaining millisecond-level data. | MDX functions such as YTD, QTD, MTD, ParallelPeriod, Lag, and LastPeriods let an analyst revisit roughly the same subject from a different temporal viewpoint. Kyvos supports these kinds of MDX time-intelligence functions. For re-observation, a stored QTD insight might be checked using MTD or the latest several periods instead. |
| Semantic-model changes | The underlying rows may not have changed, but the meaning of a business concept has. | Changing the definition of a calculated measure such as Margin, modifying a hierarchy, or altering a dimension attribute can make an old observation semantically stale. In both SSAS and Kyvos, calculated measures and semantic definitions sit above the raw facts, so provenance needs to include the definition that produced the observation. |
The common question underneath all of those items in Table 1 is:
When is previously obtained information still valid enough to use, and when should we obtain another observation (at the cost of time and compute)?
That is what I mean by re-observation.
Staleness Has Become Harder to See
There was a time when much of the information we used was physically frozen into a particular form. A paper report, dictionary, encyclopedia, price list, telephone book, map, or annual report captured what was known at the time it was printed. Updating the information generally meant producing a new artifact. The old one remained visibly old, often with a publication or reporting date printed directly on it.
Today, much of the underlying information lives in databases and other systems that can retain both a current state and extensive history. Reports, dashboards, PDFs, spreadsheets, search indexes, knowledge graphs, and other information products are increasingly built from those systems. The underlying data may continue to change—and may even preserve exactly how it changed over time—while a particular report, extract, cached result, or remembered observation remains frozen at the state it captured earlier.
That changes the character of staleness. A modern information product can look current, interactive, and authoritative while the state it represents has quietly fallen behind the systems from which it was derived. A dashboard may look alive even if its underlying extract was refreshed last night. A database may be current while a replica, warehouse, semantic model, cache, search index, or downstream application is several steps behind it. Two databases can each be internally consistent and still disagree because they represent different points in time.
The problem extends beyond conventional data systems. A knowledge graph can retain a once-valid triple long after the real-world relationship has ended. An LLM can confidently reproduce something that was true in its training data but is no longer true. Retrieval-Augmented Generation (RAG) helps by giving the model a way to obtain newer external information, but the retrieved source itself still has a time associated with it. Our own brains have the same problem: we remember facts without automatically attaching an alarm telling us that reality may have moved since we learned them.
| Where the remembered state lives | How it can become stale | Why the staleness may be hard to notice |
|---|---|---|
| Paper report, book, printed reference | The world changes after publication | Usually obvious because the artifact is visibly fixed in time |
| Exported PDF, spreadsheet, or emailed report | It becomes detached from the system that produced it | It still looks authoritative and may circulate long after newer data exists |
| BI dashboard or analytical report | The underlying extract, cache, or semantic model has not been refreshed | The interface itself still looks live |
| Database replica | Replication or CDC is behind the source | Both databases can respond normally while representing different moments |
| Warehouse or lakehouse | Source changes have not yet arrived through ingestion or transformation | Queries execute against valid tables, but the tables represent an earlier state |
| Semantic model / OLAP model | The underlying source is newer than the last processing cycle | Measures and dimensions remain perfectly queryable and internally consistent |
| Application cache or materialized result | The source changed after the value was cached | The answer is fast and syntactically correct, which can make it seem trustworthy |
| Search or vector index | Source documents changed without the index being rebuilt or updated | Retrieval works normally but retrieves an older representation |
| Knowledge graph | A once-valid fact or relationship has changed in the world | The triple remains logically valid within the graph until something updates or invalidates it |
| LLM parametric knowledge | Training captured an earlier state of the world | The model can reproduce the old fact fluently, without an inherent indication that it has aged |
| Human memory | A remembered fact outlives the circumstances that made it true | Familiarity itself can make the remembered fact feel current |
| Two operational systems | Each system updates independently or on different schedules | Neither system is necessarily “wrong”; they simply disagree about the present |
There is also a mirror-image problem. Sometimes we deliberately do not want the latest state. Time-travel queries, temporal databases, event histories, slowly changing dimensions, and historical snapshots attempt to reconstruct what the world looked like at an earlier point in time. If I ask what a customer’s status was on June 1, today’s value may be just as wrong for that purpose as a June 1 value would be for a decision made today.
So there are really two temporal responsibilities. When we want to understand the past, the system must reconstruct a coherent earlier state. When we are preparing to act in the present, it must recognize when an earlier observation may no longer describe the world well enough.
Modern computing has become extraordinarily good at storing and retrieving facts. It is much less automatic about recognizing when a fact that was once correct has quietly stopped being correct. That is the gap re-observation is intended to address.
Examples of Re-Observation
The strongest examples are cases where the remembered information is still plausible but is not obviously wrong. The danger is that conditions may have quietly changed. Table 3 lists an ample number of business examples.
| Domain | Intended action | Remembered assumption | Why it may quietly be obsolete | Useful re-observation before acting |
|---|---|---|---|---|
| Sales | Offer a discount to save an important account | The customer is at high risk of leaving | The customer may have renewed, expanded usage, or resolved the underlying problem since the churn signal was generated | Recheck recent usage, support activity, orders, and account interactions |
| Inventory | Expedite a replenishment order | Inventory is dangerously low | A shipment may have arrived, demand may have slowed, or another warehouse may now have excess stock | Recheck current inventory, inbound shipments, and recent consumption |
| Supply chain | Reroute a shipment around a delay | The normal route is still disrupted | The congestion, weather, strike, or port problem may have cleared | Recheck current transit times and disruption indicators before accepting the cost of rerouting |
| Pricing | Raise or lower a price | Demand remains unusually strong or weak | The observed demand pattern may have been temporary, or a competitor may have changed price | Re-observe recent sales, elasticity indicators, inventory, and competitor conditions |
| Marketing | Increase spending on a successful campaign | The campaign continues to outperform | Audience saturation, creative fatigue, seasonality, or competitor activity may have changed the response | Recheck the latest conversion rate, marginal acquisition cost, and recent trend rather than relying on lifetime averages |
| Credit / risk | Increase or restrict a customer’s credit | The customer’s financial condition is unchanged | Payment behavior, orders, industry conditions, or external credit information may have shifted without triggering an obvious alarm | Re-observe recent payments, utilization, exposures, and relevant external signals |
| Operations | Add staffing to a bottleneck | A particular process remains the constraint | Another constraint may have emerged, upstream demand may have changed, or the old bottleneck may already have been corrected | Recheck queue depths, throughput, cycle times, and adjacent processes |
| Finance | Cut spending because margin is deteriorating | The margin decline seen earlier is continuing | Product mix, input costs, pricing, or one-time expenses may have changed | Re-run the margin view using the newest period—perhaps the latest month rather than the original QTD observation |
| Customer service | Escalate a customer problem | The issue remains unresolved | Another team may have fixed it without updating the original case or observation | Check recent tickets, transactions, communications, and system state |
| Security | Disable an account after suspicious behavior | The account remains compromised | The password may have been reset, the user verified, or the suspicious session terminated | Check current sessions, authentication events, privileges, and remediation status before acting |
| Hiring | Extend an offer to a candidate | The position and salary assumptions are unchanged | Budget, headcount, project priorities, or the candidate’s situation may have changed during a long interview process | Reconfirm budget, role requirements, compensation range, and candidate availability |
| Project management | Continue a major workstream | Its prerequisite is still expected on schedule | A dependency can slip quietly while everyone continues working from the old plan | Recheck the dependency owner, current completion state, and downstream impact |
And the same pattern is everywhere outside business in our normal daily life. A great example most of us experience every day is crossing traffic. When I attempt to turn left out of my neighborhood into the main drag (where there is consistent traffic in both directions), I need to constantly scan left and right. There are times when I’m clear on the right but need to wait two seconds for the car coming from the left to pass by. But I’ve seen a lot can happen in the traffic on my right in those two seconds. Cars to materialize seemingly from out of nowhere.
Table 4 lists examples of assumptions in daily life.
| Regular life | Intended action | Remembered assumption | Why it may quietly be obsolete | Useful re-observation |
|---|---|---|---|---|
| Driving | Take your normal route | The road is open and normally fast | An accident, construction, weather, or event may have changed conditions | Check current traffic shortly before leaving |
| Travel | Leave for the airport at the usual time | The flight is still departing as scheduled | A delay, gate change, aircraft problem, or weather disruption may have occurred | Check current flight status before committing to the trip |
| Meeting someone | Drive to the agreed location | The other person is still going to be there | Their schedule may have changed without you knowing | Check the latest message or confirm shortly beforehand |
| Shopping | Drive to a store for a particular item | The store still has it | Inventory information may have been accurate yesterday and still look plausible | Check current stock before making the trip |
| Cooking | Use food already in the refrigerator | It is still good because it was fine recently | Spoilage is gradual and may not be obvious from memory | Look, smell, and inspect it again before using it |
| Weather | Go hiking based on the morning forecast | Conditions will remain as predicted | Mountain weather can change quickly without invalidating the earlier forecast in an obvious way | Look at current radar, clouds, temperature, and alerts before starting |
| Home repair | Drill where you remember it being safe | Nothing behind the wall has changed | Your memory of plumbing or wiring may be slightly wrong, or prior work may have altered it | Recheck with plans, a detector, or direct inspection |
| Taking medication | Take the usual dose | Nothing relevant has changed | Another medication, missed dose, changed prescription, or timing issue may alter what is appropriate | Recheck the label, schedule, or current instructions |
| Calling someone | Raise an issue based on what they told you yesterday | Their situation or position is unchanged | They may have received new information or already solved the problem | Ask what has happened since the earlier conversation |
The deeper problem is not simply that an old observation may be wrong. We often have some sense of how likely different kinds of observations are to have changed. For example, an address associated with a college student may be quite reliable one week later and much less reliable one year later. Even that probability depends on context: a week crossing the end of a semester may deserve more suspicion than an ordinary week in October.
People routinely make judgments like this from experience, but that knowledge is rarely expressed in an operational form that a system can use—a rule in Prolog or SWRL, a validity function, or a learned estimate of the probability that the observation has changed. In effect, different kinds of knowledge have different hazards of becoming invalid, and those hazards change with circumstances.
Biological intelligence handles the same underlying problem in an elegant way. Memory preserves what was previously observed, while our sensory systems continually sample what is happening now:
- Vision uses saccades and microsaccades.
- Smell uses repeated sniffing.
- Touch becomes more informative when we actively move our fingers.
- Animals turn their eyes, heads, ears, or whiskers toward things worth another sample.
These are not necessarily attempts to prove the previous observation wrong. They are ways of obtaining another observation from a world that does not stand still.
That suggests a stronger role for re-observation in Enterprise Intelligence. The system should not merely know what it observed and when it observed it. It should also have some estimate of how likely that kind of observation is to have changed by now, given the current context.
Age alone is not enough. The system also needs some estimate of how likely reality is to have moved, given what the observation represents, what has happened since, and what we are about to do.
There Are Several Levels of Data Currency
It helps to distinguish three levels of data currency (how current the data is):
- Source currecncy. Has the changed data reached the operational system, stream, database, data warehouse, or lakehouse?
- Semantic-model currency. Does the semantic model currently reflect that source data? In a materialized model such as a Kyvos Multidimensional Model, this depends on when the model was processed. In models that query the underlying data source, the answer can be closer to the current state of that source.
- Observation currency. When did we last ask the analytical question from which an insight was derived?
These are different things. The underlying warehouse may contain newer data than a materialized semantic model, while both may contain data far newer than an observation remembered by the ISG.
The last case is the one that interests me most here:
The information available through the semantic layer may be much more current than the insight we are still carrying around.
Re-Observation Can Use the Appropriate Source
Re-observation does not always require the most current data physically available. It requires evidence sufficiently current for the decision being considered.
Sometimes that evidence can come directly from the existing semantic model. If a Kyvos semantic model was processed this morning and the remembered insight is three weeks old, rerunning the analytical question against that model may be entirely sufficient.
The important point is that re-observation means returning to an analytical viewpoint, not necessarily returning to exactly the same physical representation that produced the original observation.
A remembered insight might have been derived from quarter-to-date data. Weeks later, determining whether that insight still holds might require only the latest month, week, or several days. The semantic model provides the governed business meaning and analytical coordinates; the required currency determines how current the underlying evidence needs to be.
In many cases, the most current data physically obtainable would add little. The system only needs evidence current enough for the action being considered. That is where the cost of obtaining another observation becomes important.
Where a High-Performance Semantic Layer Fits
Kyvos provides several ways of balancing analytical performance against proximity to the underlying data:
- A traditional Multidimensional Model materializes data into the high-performance multidimensional structures that give Kyvos its extremely fast analytical performance.
- A Relational Multidimensional Model (ROLAP) leaves the data in the relational database and uses that source to answer analytical queries.
- A Hybrid Multidimensional Model (HOLAP) combines the approaches: queries involving materialized dimensions and measures can use pre-aggregated data, while queries involving non-materialized elements can be delegated to the underlying relational SQL engine. Kyvos also supports non-materialized semantic models, where an external SQL engine calculates values at query time.
That is not the same mechanism as Power BI’s Hybrid table, where historical data can remain in Import partitions while the latest data beyond the incremental refresh period is retrieved through a DirectQuery partition. But both architectures illustrate the larger principle that a semantic layer does not have to imply one physical method of retrieving every answer.
For the re-observation idea, however, the most important Kyvos capability is much simpler: pre-aggregation can make returning to an analytical viewpoint very quick and inexpensive.
Re-observation Does Not Necessarily Require Real Time
By real-time, I mean the current state—not yesterday’s state or even the state a minute ago. Suppose the ISG contains an observation:
Revenue growth has slowed substantially this quarter.
That observation may have been made three weeks ago. Before allowing an AI system or a person to rely heavily upon it, we might want another observation. We probably do not need to know about a transaction that occurred three milliseconds ago. If the Kyvos model was processed this morning, that might be entirely sufficient.
And we do not necessarily have to run precisely the same quarter-to-this-very-moment query again. We might look only at the most recent month, week, or several days to determine whether the behavior underlying that observation is continuing.
In other words, the query gives us an analytical viewpoint from which we can re-observe. It does not require us to reproduce the original observation mechanically.
We might ask:
- What is it now?
- What has happened during the latest month?
- Is the trend continuing?
- Has the anomaly disappeared?
- Has the relationship become stronger or weaker?
Those sound like ordinary BI questions because they are ordinary BI questions. The difference is that the ISG can “ask” them too.
Adequate Currency, Not Maximum Currency
There is therefore a spectrum of places from which a re-observation might be made in a typical analytics/BI/event pipeline.
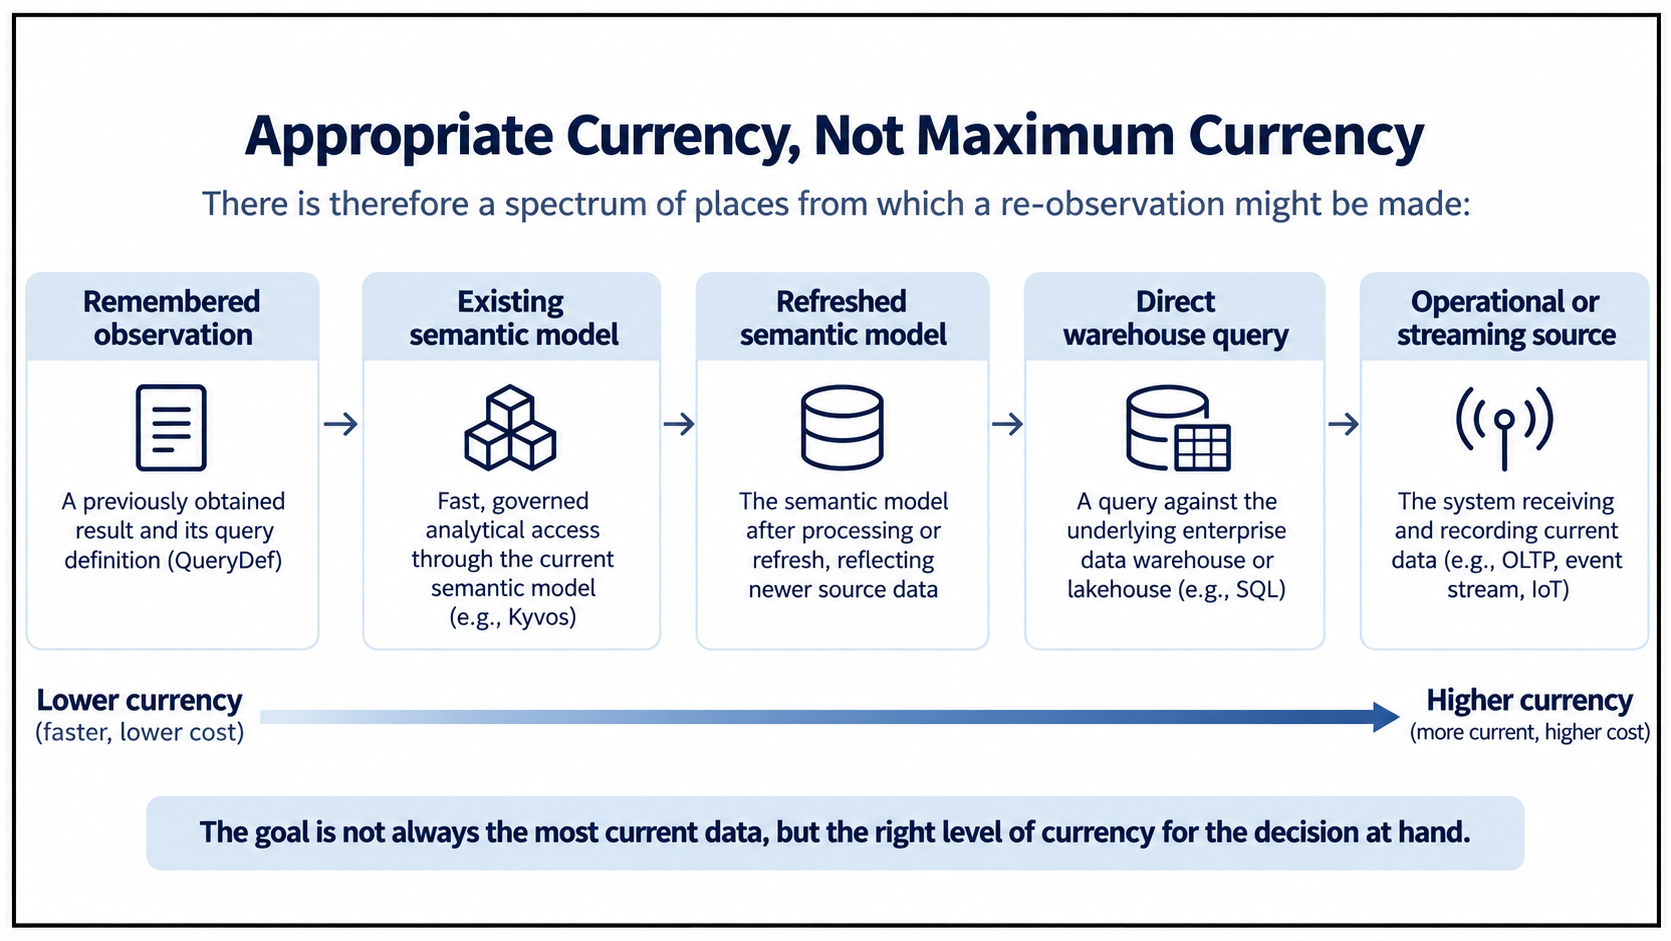
We do not always need to move all the way to the right. A supply-chain control system deciding whether to reroute a truck may need information that is seconds old. An AI system reconsidering an observation about quarterly margin may find this morning’s processed semantic model perfectly adequate.
What counts as current enough depends on the decision. The required currency of an observation depends on how quickly the underlying situation can change, how consequential the action is, and how costly it would be to obtain another observation.
For many analytical decisions, the most current data physically obtainable would add little. What we need is evidence current enough to support the action we are considering.
That is why a fast, pre-aggregated semantic layer remains so important—in fact, foundational. It may not always provide the last millisecond of activity. But it can make it extremely cheap to revisit enormous amounts of enterprise data and obtain another observation.
And that changes the economics of intelligence. If another observation is expensive, we tolerate stale knowledge. If another observation is cheap, we can afford to doubt ourselves.
High-Performance Semantic Layer as the Foundation
I don’t merely mean a place from which to retrieve data, but a governed semantic layer capable of repeatedly slicing enormous volumes of enterprise data quickly enough that this kind of background intelligence is practical. That is why I have repeatedly pointed to Kyvos. A system that potentially captures, tests, connects, revisits, and refreshes huge numbers of analytical observations has a very different workload from a few people occasionally opening dashboards.
OODA: Re-Observe Before Acting
There is another thread through my prior work that deserves to be called out separately. That is, OODA loop—Observe, Orient, Decide, Act.
We observe the world, orient ourselves within what we observed, decide what to do, and act. But while we are doing that, time passes, other actors act, conditions change, and our own action may alter the system. So I propose an optional re-observation between decide and act.
That matters even before an action is taken. If enough time or consequential change separates the original observation from the intended action, some of the observations supporting our orientation may deserve another look before we take our physically irreversible action. Granted, that luxury of time doesn’t exist for the original OODA application, a battle between fighter jets. But in the business world, there is usually some wriggle room.
I have approached OODA-like concepts from several directions:
- March 14, 2025 — Beyond Ontologies: OODA Loop Knowledge Graph Structures. This is my main treatment of OODA. Rather than treating Observe, Orient, Decide, and Act as four labels, I explored structures that could make the loop machine-readable and traversable. Observation is grounded in data and events; orientation assembles context; decisions select courses of action; actions change the world and feed new observations back into the loop.
- March 29, 2025 — Closer to Causation. I emphasized that recognition and action do not happen just once. We recognize a situation, choose an action, observe what happens as a result, and use that new observation as the starting point for another loop. In the terminology of this blog, that new observation is a re-observation.
- February 2, 2026 — Explorer Subgraph—The Dynamic Cartography of Relation Space. Here the emphasis shifts toward Orient. System ⅈ and the Explorer Subgraph continually probe what the enterprise is observing and help construct a transient field of attention before deliberate reasoning begins. Orientation itself therefore depends upon observations that can age.
- March 4, 2026 — The Products of System 2. I explicitly used an operational OODA process to distinguish recognition and execution from the deeper reasoning required when orientation or decision breaks down. This places OODA inside the larger System ⅈ / System 1 / System 2 architecture rather than treating it merely as a decision-making metaphor.
- June 15, 2025 — Thousands of Senses. This develops the observational side from another direction. An enterprise increasingly has enormous numbers of possible senses—BI queries, applications, IoT devices, event streams, and eventually agents. The problem is not simply collecting more data, but obtaining the subset of current observations relevant to the decision at hand.
Re-observation therefore does not add another letter to OODA. It makes explicit something the loop already requires.
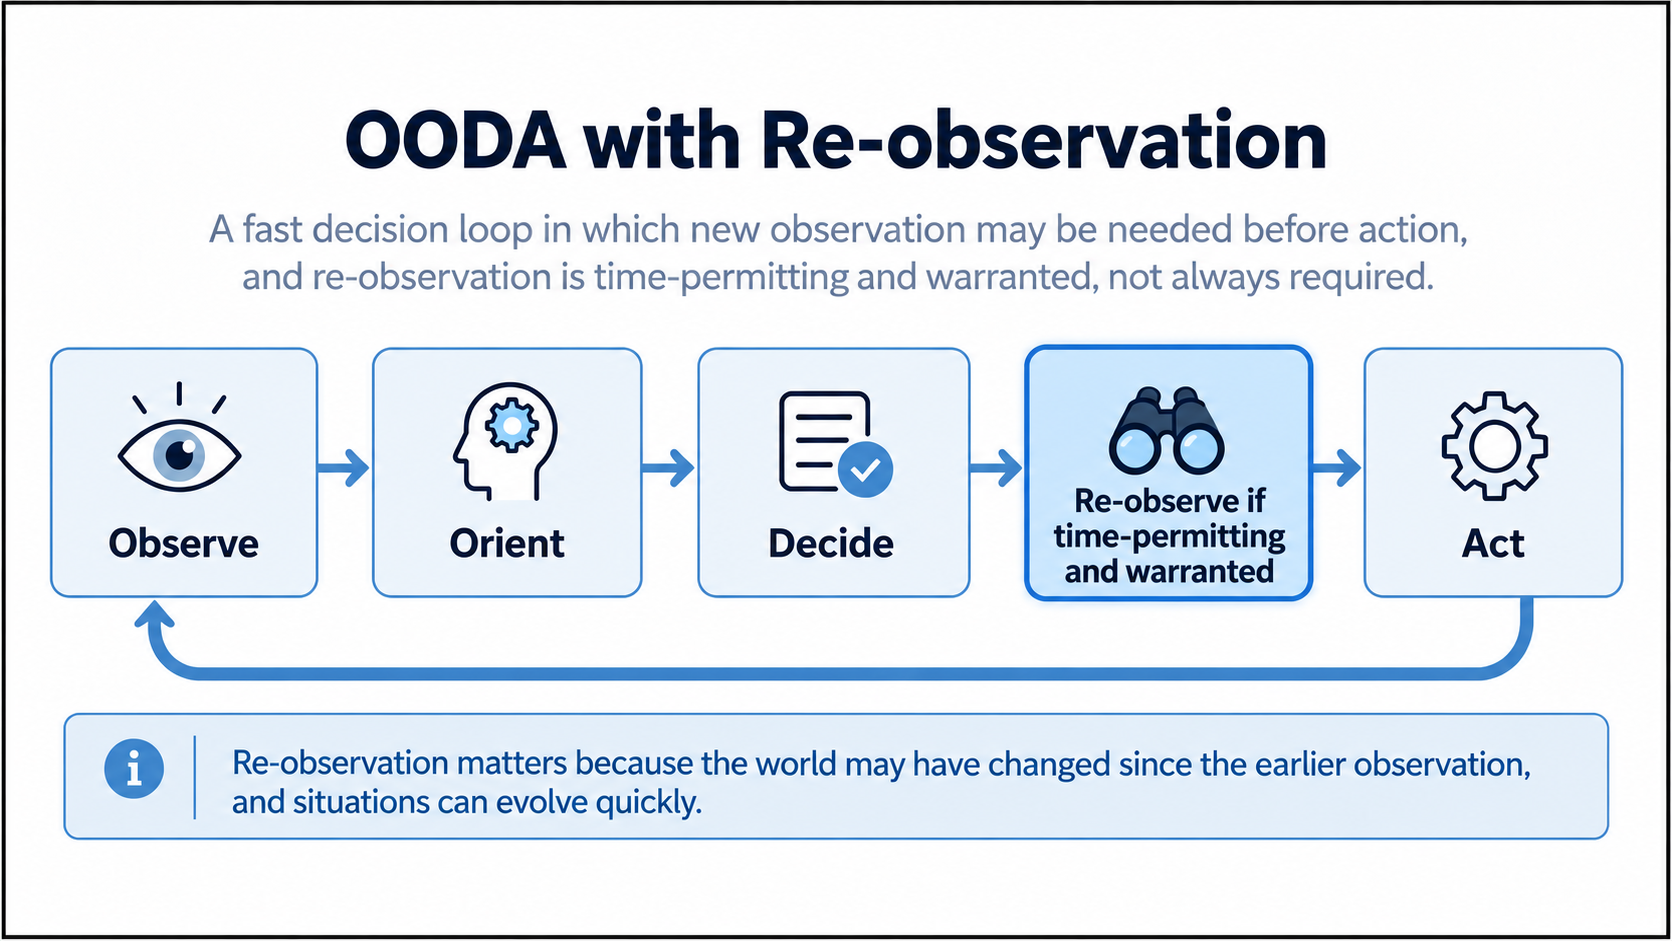
The “re-observation” is conditional: before committing an action, has anything important changed since the observations that produced our orientation? A high-performance semantic layer makes it much cheaper and faster to determine whether the analytical assumptions supporting an intended action are still sufficiently true.
I’ve approached that architecture from quite a few directions already. Before adding yet another article to the pile, here are some of the places where I’ve developed the various pieces of it:
- The Role of OLAP Cubes in “Enterprise Intelligence” June 20, 2024 I connect Enterprise Intelligence to OLAP performance and Kyvos’ scale-out architecture. The argument is already there: enterprise intelligence implies huge numbers of analytical requests, and pre-aggregation makes those requests practical rather than theoretical.
- Enterprise Intelligence: Integrating BI, Data Mesh, Knowledge Graphs, Knowledge Workers, and LLMs June 28, 2024 This lays out the overall architecture. BI isn’t displaced by AI; it is integrated with Data Mesh, knowledge graphs, SMEs, and LLMs. That is important to Kyvos because the semantic BI layer sits beneath the new intelligence structures rather than becoming an obsolete reporting tier.
- The Intelligence of a Business July 15, 2024 This explains the soul of the book: the enterprise as an intelligent organism assembled from existing technologies rather than AI replacing everything. I describe BI as the highly curated, established spearhead of the architecture. Kyvos’ role follows naturally as the high-performance semantic implementation of that sensory/BI layer.
- Charting the Insight Space of Enterprise Data September 13, 2024 This is probably the clearest early statement of the one-two punch I’m revisiting here. Thousands of analysts perform ordinary BI work. Their queries can be passed through the Insight Function Array; potentially useful observations become persistent ISG material; the TCW then connects those observations across domains through relationships including time. I explicitly start from BI as deterministic, curated, and reliable.
- The BI Counterpart to AI Infinite Context November 21, 2024 Here the ISG and TCW become a kind of enterprise memory: don’t retain every raw experience; retain salient abstractions that can later be recalled. The post explicitly connects the TCW, ISG, and CubeSpace as the semantic layer.
- BI-Extended Enterprise Knowledge Graphs July 18, 2025 This connects Enterprise Intelligence and Time Molecules through the TCW and makes the performance argument unusually explicit. I describe Kyvos as contemporary pre-aggregated OLAP/semantic-layer technology and explain why repeated slice-and-dice against enormous fact volumes benefits from precomputed aggregation. The raw facts may number in the billions or trillions; the answer the intelligence layer needs may consist of only dozens of aligned observations.
- The Ghost of OLAP Aggregations – Part 1 August 1, 2025 This explains why the apparently old-fashioned idea of caching expensive multidimensional calculations becomes more valuable in an AI-heavy architecture. Kyvos isn’t merely an aggregation engine; the semantic layer also supplies understandable, governed business meaning.
- The Ghost of OLAP Aggregations – Part 2 September 1, 2025 Here I go further into why Kyvos differs from simply throwing Snowflake or Databricks compute at the problem. Kyvos is the semantic/pre-aggregation specialist: governed definitions plus high-concurrency business queries. That’s precisely the workload the later ISG/TCW architecture creates.
- Stories Are the Transactional Unit of Human-Level Intelligence October 10, 2025 This brings the ISG and TCW into my larger reasoning architecture. I describe the ISG as capturing analysts’ BI queries and extracting observations through the IFA, while the TCW supplies a web of empirically observed relationships. BI activity becomes raw material for larger stories and abductive hypotheses rather than ending at a dashboard.
- Context Engineering and My Two Books October 17, 2025 This is particularly relevant to a Kyvos audience. I argue that AI agents need fast, composable BI retrieval and point directly to pre-aggregated OLAP such as Kyvos. The same structures that once fed dashboards can now feed context windows. Kyvos becomes a governed context source for AI rather than merely another database.
- System ⅈ: The Default Mode Network of AGI January 8, 2026 This takes the ISG/TCW from analytical memory toward background cognition: broad, parallel exploration occurring underneath focused reasoning. I explicitly describe a stored BI query being rehydrated from the BI source, with an accelerated model such as Kyvos providing a fast way to do so.
- Explorer Subgraph—The Dynamic Cartography of Relation Space February 2, 2026 This turns the architecture toward continuous background exploration. I describe BI platforms as foundational architecture, point to Kyvos’ cloud-scale semantic layer and acceleration, and note that TCW computations can involve millions to trillions of rows. BI acts as the authoritative source from which cached relationships can be refreshed or reconstructed.
- Chains of Unstable Correlations February 13, 2026 This extends the TCW beyond static linear correlations. The importance for Kyvos isn’t the particular correlation algorithm; it is that a continuously changing TCW must repeatedly pull aligned historical measures from the underlying BI substrate to determine whether relationships still hold. The smarter and more dynamic the correlation web becomes, the more important inexpensive re-querying becomes.
- Insight Function Array: How the Insight Space Graph Notices, Remembers, and Connects August 26, 2026 This is probably the immediate predecessor to this post. I spell out the mechanics: ordinary Tableau/Power BI queries return dataframes; the IFA examines those same results for spikes, trends, intersections, clusters, outliers, correlations, and other features; and potentially useful findings survive after the visualization disappears. I also emphasize that the compression must be fast so feature detection can ride along with normal interactive analysis against a semantic layer such as Kyvos.
- KPI-First Probing of the Tuple Correlation Web September 5, 2026 Here the architecture becomes more selective. Instead of calculating the combinatorial TCW blindly, KPIs, shared elements, and IFA observations nominate places worth investigating. The semantic layer supplies consistent meanings and rapidly retrieves the aligned history needed to test those hypotheses. The semantic layer is fundamental to the TCW, and Kyvos’ pre-aggregated performance makes repeated widening of the investigation practical.
With all of that documentation (at least 15 blogs, a book, and a number of live presentations), it won’t help to write about this all over again. Instead, I want to add one behavior that I now think makes the role of a very fast semantic layer much clearer.
Before We Take Our Action
All of that leads to the part I want to add now:
Remembering an insight solves one problem but creates another: the world may have changed since we learned it.
That sounds obvious, but it has an important architectural consequence. An intelligent system should not simply accumulate observations and then treat the most recent stored value as truth forever. Before making a consequential move based on something it remembers, it should have some way to ask whether the assumptions behind that remembered insight are still sufficiently valid.
The crude alternative is essentially last non-empty (listed earlier in Table 1): this is the last thing we knew, so use it. In other words: Checking assumptions should be a very common thing.
Sometimes that is perfectly reasonable. Rechecking everything continuously would be wasteful and, at enterprise scale, potentially enormous. But it should be a choice rather than an accident.
The better approach is to retain enough information with an insight to determine whether it is worth checking again.
That might include a hard expiration date. It might include an expected rate of change. A correlation could retain important coefficients and tolerances. A KPI observation might carry thresholds. A machine-learning result might have indicators of model drift. A business event could invalidate an entire class of observations immediately. Historical behavior might tell us that one measure is extremely stable while another routinely changes several times a day.
Taken together, those things can provide something like a probability that the stored insight is no longer sufficiently valid.
That does not mean we need a perfect probability model. Even a rough ordering is enough to prioritize. If the system has a million remembered observations, there is little reason to spend equal effort refreshing all one million. Start with the ones most likely to be wrong.
The system therefore needs to determine which assumptions are most worth checking right now. That is an intelligence problem in its own right. The system can consider factors such as:
- Age. How long has it been since the observation was made?
- Volatility. How quickly does the underlying phenomenon normally change?
- Related changes. Have other data points or events changed in ways that could affect the observation?
- Semantic changes. Has the definition of a measure, dimension, or other business concept changed?
- History. How reliably has this particular observation remained valid in the past?
- Consequence of being wrong. How much depends on the assumption still being true?
The last factor can outweigh the others. A relatively stable assumption behind a multimillion-dollar decision may deserve rechecking even when its estimated probability of having changed is low.
Revalidation effort should concentrate where stale knowledge is most likely to affect a decision. Keeping every observation perfectly current would be wasteful.
If checking an assumption takes a “long time” (many seconds to minutes), consumes significant compute, or requires a batch process, the system will naturally tolerate more uncertainty. It will use the last known value because looking again is expensive.
If checking that assumption takes a fraction of a second against a governed semantic layer, the decision changes. We can afford to ask: Before we take an action, are our assumptions still true?
That is where I think a platform such as Kyvos becomes especially important to Enterprise Intelligence. Its value is not simply that an analyst gets an answer faster. A sufficiently fast semantic layer lowers the cost of doubt.
It makes it practical for the system to challenge its own remembered observations.
And even that can be optimized further. We do not need to blindly rerun every query on a timer. The ISG can first estimate which observations are most likely to have become invalid, prioritize those observations, perform inexpensive checks where possible, and return to the underlying BI data only when a fresh observation is warranted.
Conceptually, the loop becomes:
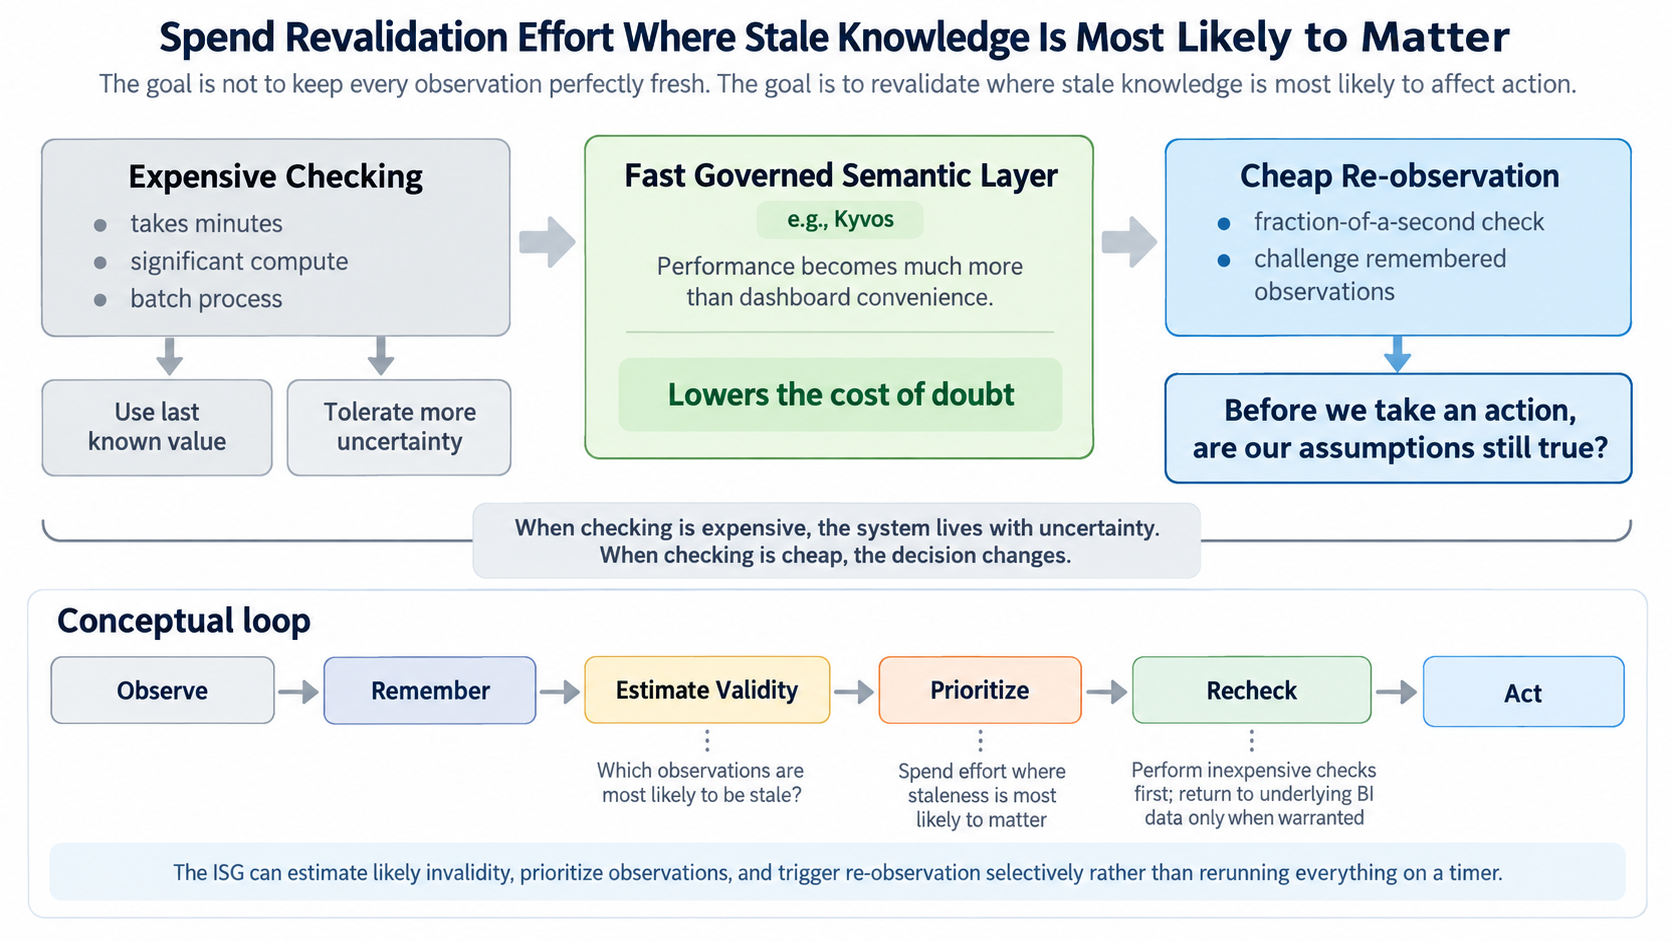
There is an analogy here to optimistic concurrency in software. We do not lock everything merely because something might change. We proceed using the state we have, but when the consequences of being wrong is significant, we verify that the assumptions we depended upon still hold before committing the action.
But that is an optimization of the larger principle, not the principle itself. The principle is much simpler:
Intelligence should be willing to challenge what it thinks it already knows before acting on it.
And the cheaper we make that challenge, the more often we can afford to do it.
Insights Should Have a Validity Policy
Different observations decay at different rates. Yesterday’s shipping backlog may require frequent refresh. A slowly changing customer segmentation may not. Some insight types might even learn appropriate refresh rates from their history. The ISG becomes a collection not merely of remembered observations, but observations with different expectations of how long they are likely to remain valid.
An observation stored in the ISG should not quietly become permanent truth. But neither should every insight simply expire after an arbitrary number of days. Different kinds of insights can have different ways of determining whether they should still be trusted.
In other words, along with the insight and the query that produced it, the ISG could store a validity policy describing how and when that insight should be tested again.
Some possibilities:
- Hard expiration. Some observations have a known shelf life. An insight may simply specify, “Do not consider this valid after September 30,” or “This observation is valid for seven days.” After that date it must be refreshed before it can be used as current evidence. This is probably the simplest case.
- Time-based refresh. Other insights could specify a refresh interval rather than a hard expiration: look again every hour, day, week, quarter, and so forth. The interval could depend on the expected volatility of the thing being observed. Inventory might need frequent refreshes; a long-term customer demographic pattern might not.
- Tolerance functions. Validity could be expressed as a function. For example, an insight might have recorded that conversion rate was 4.7%, with a validity rule saying that the observation remains materially representative as long as the current value stays within some range around that value. The parameters of the function—the tolerance, bounds, or other coefficients—travel with the insight.
- Model-coefficient validity. Suppose the insight is a correlation, regression, cluster, trend, or other model-derived observation. Rather than merely asking whether enough time has passed, the system could periodically recompute selected coefficients and compare them with the stored ones. If a correlation of 0.82 has fallen to 0.31, or a regression coefficient has moved beyond a specified tolerance, the relationship itself has changed even if none of the underlying measures crossed a simple threshold.
- Significance or confidence tests. The validity policy could require that a statistical relationship continue to meet a minimum level of evidence. An insight might still exist historically while being demoted from currently supported to no longer sufficiently supported.
- Boundary conditions. Some insights are valid only while particular conditions hold. “Late delivery correlates with churn” might apply only to a specific product family, region, customer type, or economic regime. If one of those conditions changes, the insight can be marked for re-evaluation immediately rather than waiting for a timer.
- Event-triggered invalidation. Certain business events might invalidate whole classes of observations. A pricing change, acquisition, plant closure, product redesign, accounting-rule change, new sales territory, or major semantic-model revision could tell the ISG, “Everything depending on this assumption needs another look.”
- Source or definition changes. An insight can become questionable even when the underlying business has not changed. If the semantic definition of Customer, Revenue, or Late Delivery changes, observations derived from the old definition should not silently be compared with observations derived from the new one. Provenance and versioning therefore become part of validity.
- Re-observation. And sometimes the best test is simply to execute the stored QueryDef again and run the relevant Insight Function. This is the closest analogue to the biological saccade: return to approximately the same analytical viewpoint and see what is there now.
Those validity policies describe how an individual observation might be judged. But once re-observation becomes part of the architecture, several broader implications follow. The system must absorb the additional workload, decide where fast BI changes what is practical, reconnect refreshed observations to the TCW, and—most importantly—be tested incrementally rather than built all at once.
A few practical consequences follow:
- Looking Again Is a Workload. This is where Kyvos enters naturally rather than as an advertisement. Capturing analyst queries is one workload. Running IFA functions against their results adds another. Refreshing selected observations adds another. TCW exploration adds still more. Add AI agents and the number of analytical consumers may rise dramatically. The question becomes whether re-observation is cheap enough to perform routinely rather than exceptionally.
- Fast BI Becomes Part of Cognition. This is probably the conceptual center of the article. Performance is normally discussed as user experience: the dashboard renders in one second instead of fifteen. Here performance changes what the system is capable of doing. If a query costs too much, the system remembers an old answer. If it is cheap, the system can look again. Latency and cost therefore influence the quality of the enterprise’s internal model of reality. That’s a much stronger reason for acceleration than impatient dashboard users.
- Then the TCW Asks: What Else Was Happening? Once an observation is refreshed, the TCW can examine aligned observations elsewhere. A Sales anomaly may coincide with Marketing, logistics, pricing, inventory, weather, or something nobody originally connected to the Sales investigation. Time supplies the common coordinate. Now the saccade isn’t merely “is this still happening?” It can also become “what else should I look at?”
- Don’t Build the Whole Brain—Run an Experiment. Take one existing Kyvos model. Capture a manageable population of normal BI queries for perhaps thirty days. Run a limited set of Insight Functions against the returned dataframes. Persist the QueryDefs and salient observations. Choose some observations to refresh. Then examine what was discovered that analysts didn’t explicitly record and whether apparently independent investigations intersect.
Conclusion: Make Re-Observation as Economically Painless as Possible
Intelligence doesn’t succeed because it captured reality perfectly the first time. It succeeds because it can detect change, obtain another observation, compare that observation with expectation, and pivot. The enterprise already has thousands of eyes—its analysts, applications, BI tools, and increasingly its agents. What it generally lacks is a mechanism for remembering where those eyes looked, what they encountered, and when it might be worth looking again.
If you already have a large Kyvos semantic model, much of the difficult foundation is already there. You have the governed business semantics. You have the performance. You have the analysts generating the queries. My book, Enterprise Intelligence, describes how to build an enterprise knowledge graph of insights and correlations, which underlies the most powerful form of inference, abductive reasoning.
The repository refresh is where I intend to make re-observation—and this idea of challenging remembered knowledge before acting—concrete.


